This page provides an outline of two closely related patents WO2010/142977 A1(Dec 2010) "Assisting Failure Modes and Effects of a system" WO2012/146908 A1(Nov 2012) "Automated Method for Generating Symptoms Data for Diagnostic Systems" In both cases the patents were sponsored by BAe Systems, following work undertaken by myself as an investigator on the ASTRAEA project.
WO2010/142977 A1
This work builds on the ability to produce a comprehensive automated Failure Modes and Effects Analysis (FMEA) using qualitative model based reasoning techniques. The automated FMEA provides a comprehensive set of fault--effect relations by qualitative simulation and can be performed early in the design process. The comprehensive nature of the automated FMEA is leveraged in WO2012/146908 A1 to automatically generate a set of symptoms that can involve many observations and infer potential faults. Common system engineering requirements are to assess the 'diagnosability' of a system (either for troubleshooting manuals or on board diagnostics), facilitate cost reductions by removing sensors or to improve diagnosability by including additional sensors. The qualitative nature of the symptoms allow a visualisation of the 'diagnosability' of the system allowing an engineer to quickly experiment with the visibility of observations or sensor selection and assess the resulting diagnosability characteristics of the system during the early stages of design. The proposed technique provides an engineer with easy access to information about diagnostic capability via a matrix visualisation technique. An example application used to illustrate this page is the fuel system of an Uninhabited Aerial Vehicle (UAV) although the system has also been used on an automotive electrical system, and is applicable to a wide range of schematic and component based systems.
The following image shows a set of symptoms automatically produced by simulation in an interface that allows manual evaluation of the symptom set. ie. the engineer inserts a known fault(s) and exercises the system (top left), in this case by adjusting valves and switches etc.
The system then uses the symptoms to produce a ranked list of faults as shown at the bottom right.

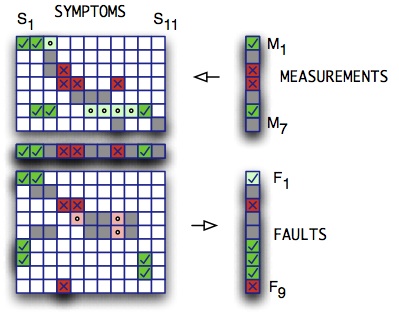
While this provides a useful sanity check, a different approach is required to support a broader understanding of the (potential) diagnosability of the system. The main concept is the ability to display the relationship between sensor observations, symptoms and faults as in the illustration.
To gain a much better understanding of the relationships contained within either matrix they can be automatically reformed into an 'approximate diagonal form' -described in the patent- which places all the non empty matrix elements as close to an imaginary line from top-left to bottom-right as possible (this is the purpose of the "Order" buttons on the tool interface below). The illustration shows the ordered fault-symptom matrix for an aircraft fuel system. Intuitively the groups of related symptoms and faults appear as visual patterns in the diagonal matrix.
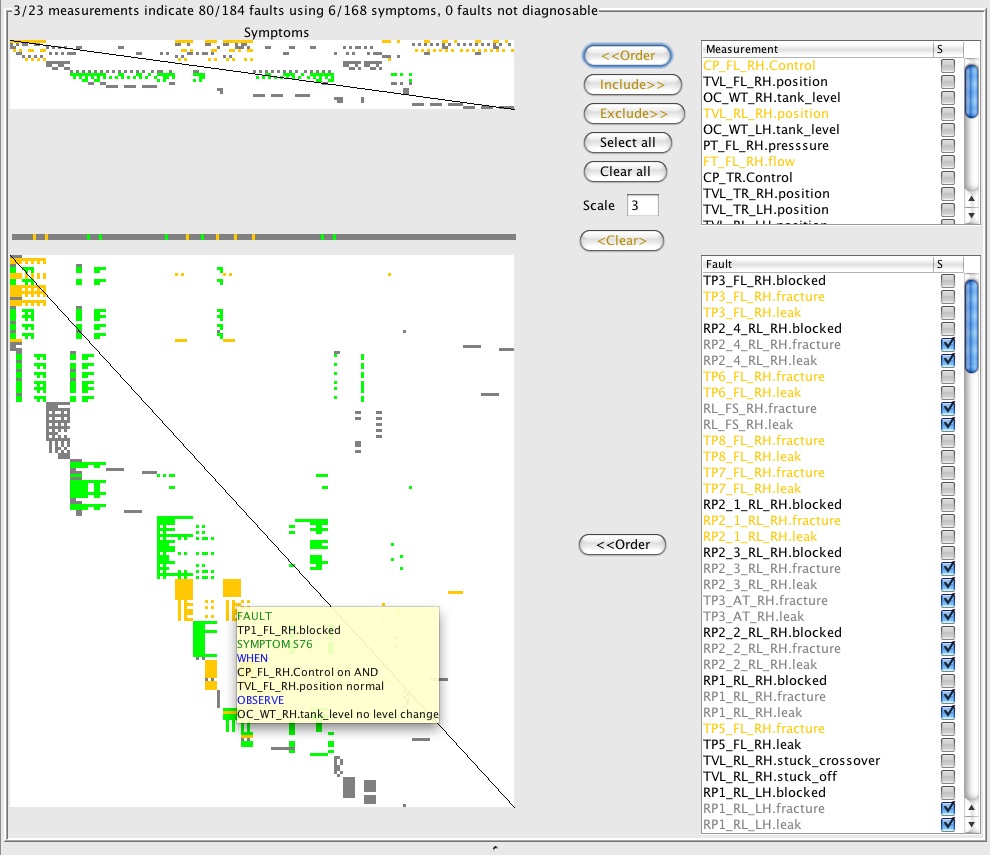 The visual presentation provides further information as follows:
- Highly populated rows in the measurement-symptom matrix shows measurements that participate in many symptoms and are therefore important to the diagnostic system.
- Similar patterns existing in more than one row of the measurement-symptom matrix indicate that there are several measurements required as a set, for a given a set of symptoms. In practice we find measurements (inputs) such as valve positions and switches that affect major system state typically have this characteristic.
- Highly populated columns in the measurement-symptom matrix indicate symptoms that require many measurements.
- Highly populated columns in the fault - symptom matrix indicate symptoms that can diagnose many faults. These are the symptoms that provide cheap detectability, but poor fault isolation.
- Similar patterns in several fault - symptom columns show that there may be a choice of symptoms that diagnose the same set of faults.
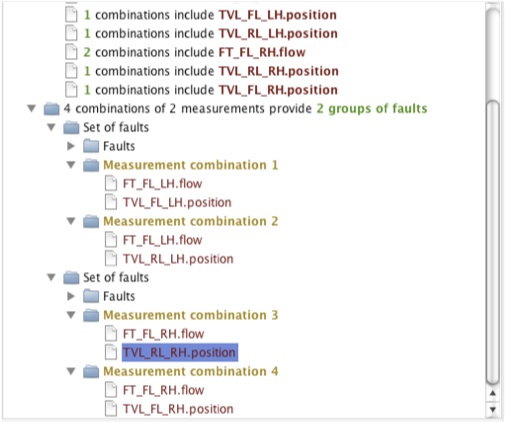 As an illustration we may wish to find the 'best' set of n sensors that can diagnose all system faults in at least one operating mode.
The user can request an exhaustive search for the next best n measurements that provide the maximum number of fault detections.
The illustration demonstrates one reason why a completely automated solution to such tasks is difficult;
adding one additional measurement six faults can be detected (i.e. the left pressure sensor detects 6 blockage faults in the left system and the right pressure sensor detects 6 blockage faults in the right system).
However, it also possible to detect 80 faults by adding two measurements.
The skilled user will appreciate that there are two groups of faults that can be detected (left and right variants).
Considering the first set of faults, it is apparent that the flow meter measurement is common, plus either of the left flow or return valves.
An engineer would know that both valves are, in fact, mechanically slaved and so the measurements are equivalent, save for a mechanical linkage failure (the mechanical aspects of the system are not modelled or included in the FMEA in this example).
If it is known that the flow valve is most closely connected to the actuator and return valve slaved to it then this is the one to choose.
Thus, the flow left and right meters and flow valves are selected as it is pointless to diagnose only left or right systems.
Further details of the techniques can be found in my PHM09 conference paper.
WO2012/146908 A1
This work provides a technique to produce diagnostic symptoms from an automated FMEA. An FMEA is produced by extensive simulation of the system for all component faults and a wide range of operating scenarions. These scenarios are chosen by an engineer to include as much of the significant operating state as possible. It is however impractical to exercise all system state and this means that it is not possible to simply reverse lookup an FMEA to perform diagnosis because in effect we only have a few 'shapshots' of the behaviour space.
These snapshots are however distributed widely across the state space of the system, and we use this fact to allow interpolation and extrapolation of the FMEA results to produce symptoms that are neither too specific or too general. To achieve, this the simple functional model of the system used by the FMEA for the purpose of reporting system function state (function achieved, failed, inoperative, spontaneous) plays an important role in allowing the relationship between components and functionality, which in turn allows inferences about the relevance of measurements in the diagnosis of specific faults. In effect this information them allows generalised symptoms to be produced by excluding irrelevant measurements from failure states of the system. The details covered by this patent were subsequently published in our AEI paper below. There is also a draft version available.
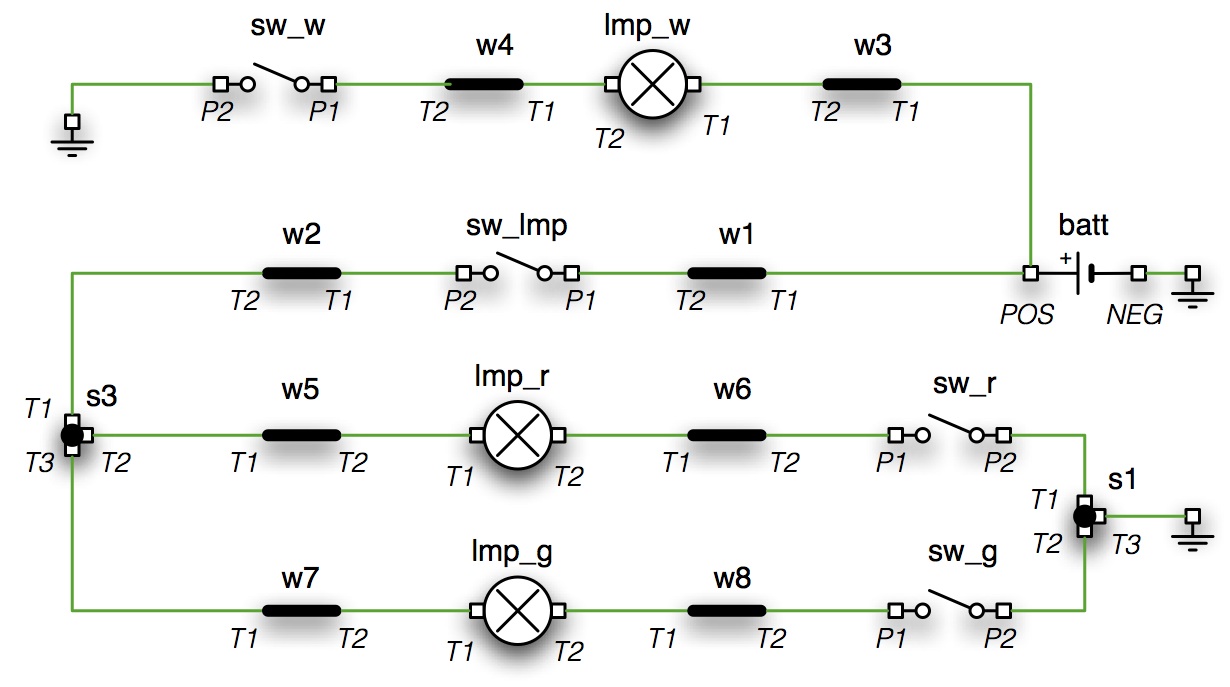 Illustrating using the trivial circuit on the right, the symptoms below are produced.
In this case in the FMEA scenario was
- the Lmp_w switch was turned on
- the Lmp_r switch was turned on and off
- the Lmp_g switch was turned on and off
- the Lmp_w switch was turned off
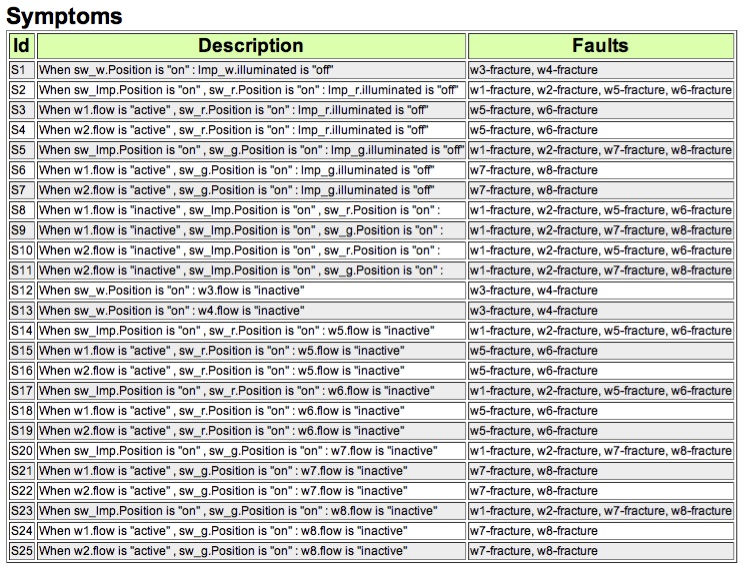
Abstract: N. Snooke, C. J Price, Automated FMEA Based Diagnostic Symptom Generation, Advanced Engineering Informatics, AEI 2012, Vol. 26, pp. 870-888
The comprehensive on-board diagnosis of faults in many aerospace and other engineered systems requires real time execution using limited computational resources, and must also provide verifiable behaviour. This paper shows how a diagnostic system satisfying these requirements can be automatically generated from the model based simulation used to produce an automated Failure Modes and Effect Analysis (FMEA). %using the sophisticated component based executable models produced as part of the design process. The resulting diagnostic system comprises a set of efficiently evaluated symptoms and their associated faults. The symptoms are complete in that they include all necessary observations required to determine applicable system operating states, unlike other work that finesses this problem by having models for each operating state and producing diagnostics for each operating state separately. The symptoms are also efficient because they abstract complex system behaviour based on observations available to the diagnostic system and only preserve sufficient symptom detail to isolate faults given these available observations.
This work has been done in the context of diagnosing autonomous aircraft, and is illustrated with examples from that domain. The models used as a basis for automated generation of diagnostics were originally produced to automate the production of a FMEA report, and the paper also considers the relationship between FMEA and diagnostics that provides verification of the failure effects predicted by the simulation and hence validation of the generated symptoms.