PCOT
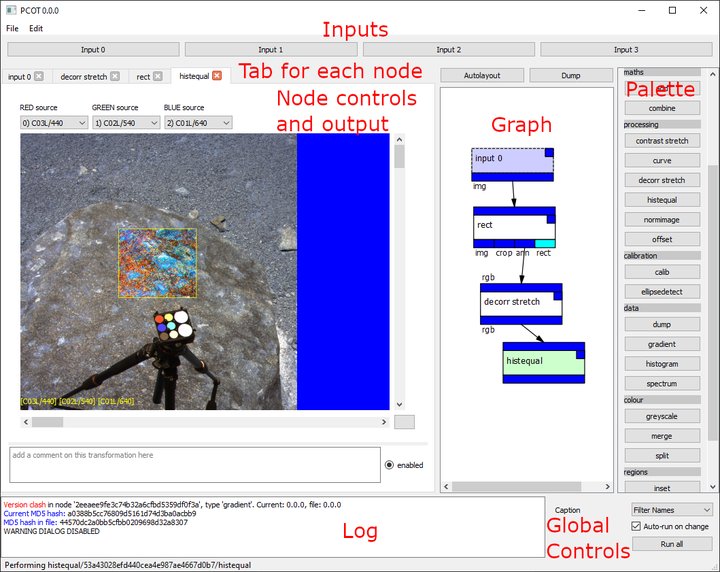
PCOT is both a Python application and a library for processing data obtained from the PanCam cameras on the Rosalind Franklin ExoMars rover. Primarily it deals with calibrating and processing multispectral images, although it also deals with other kinds of data. It is open source software: click here to view the repository.
A PCOT document consists of a directed graph of nodes which perform transformations of data (usually an image, but not always). The inputs to a PCOT graph are read directly from the DAR (Data Archive) in the Rover Operations Centre (but can be cached). Scientists and engineers can share PCOT documents and see the exact transformations which were used to generate the images/data they produce.
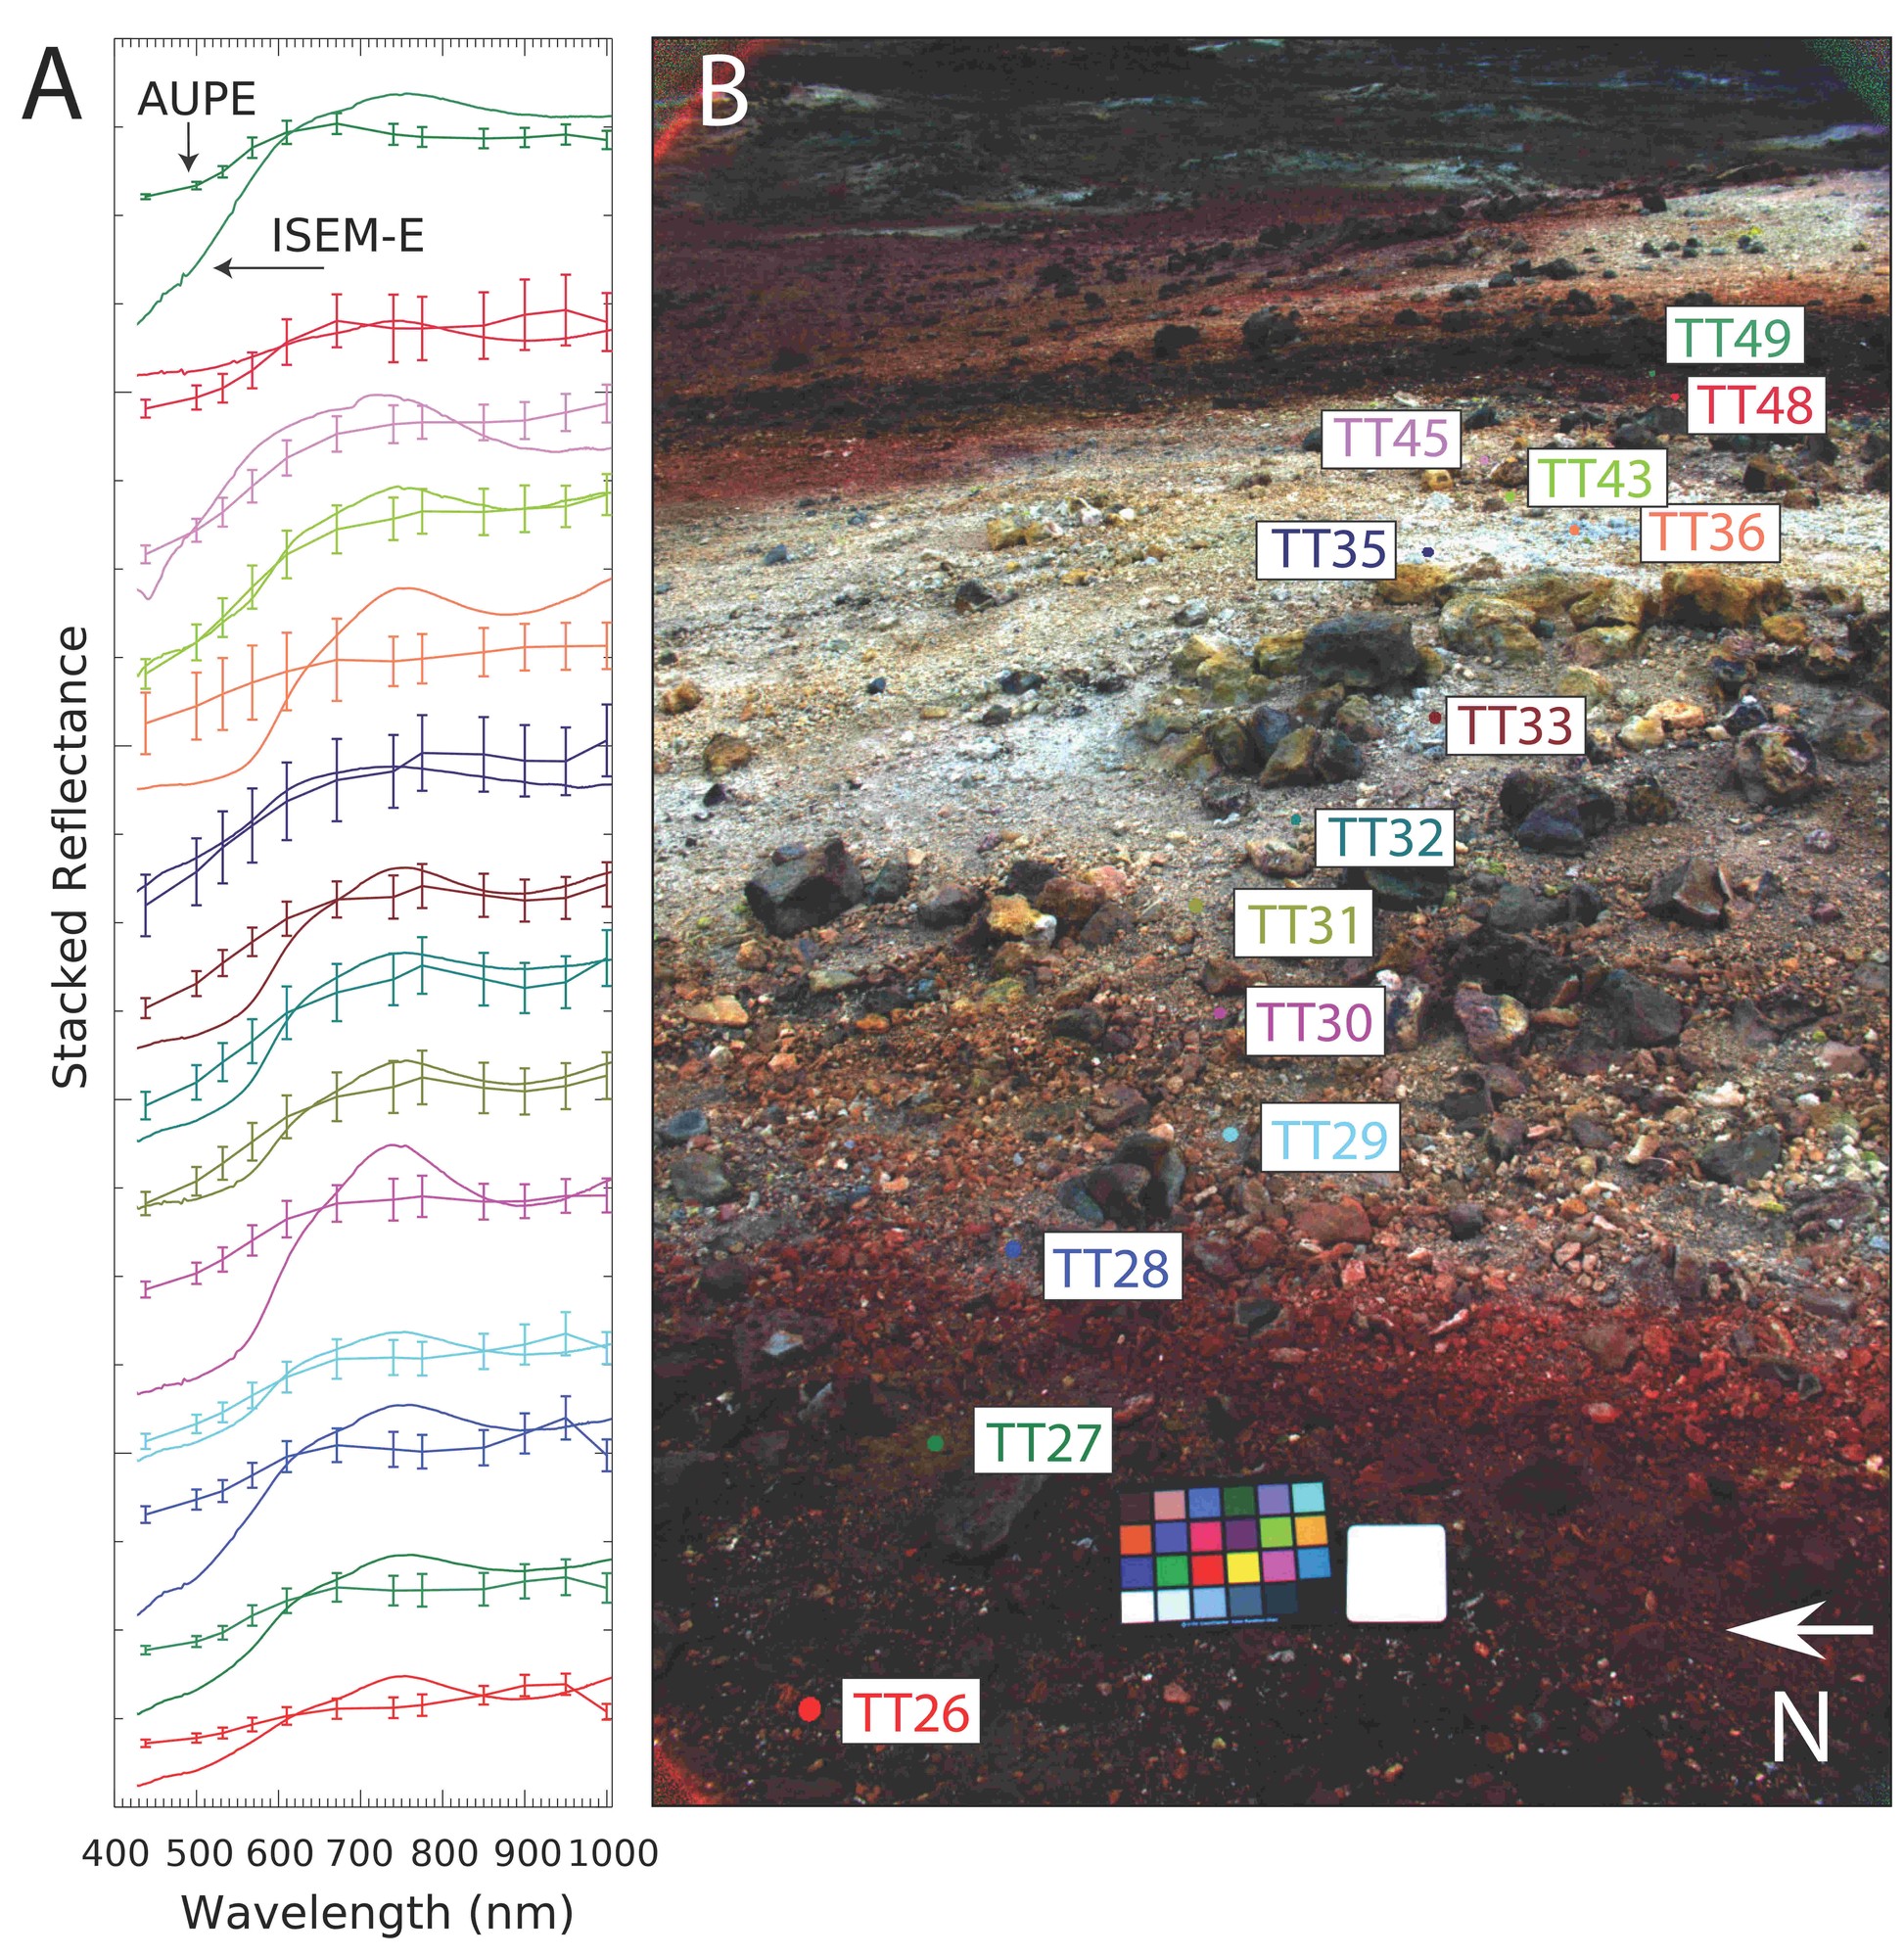
For example, here is an image produced the traditional way:
Here is a pair of images showing similar data in PCOT (although I haven’t added all the ROIs, and the data is currently uncalibrated):
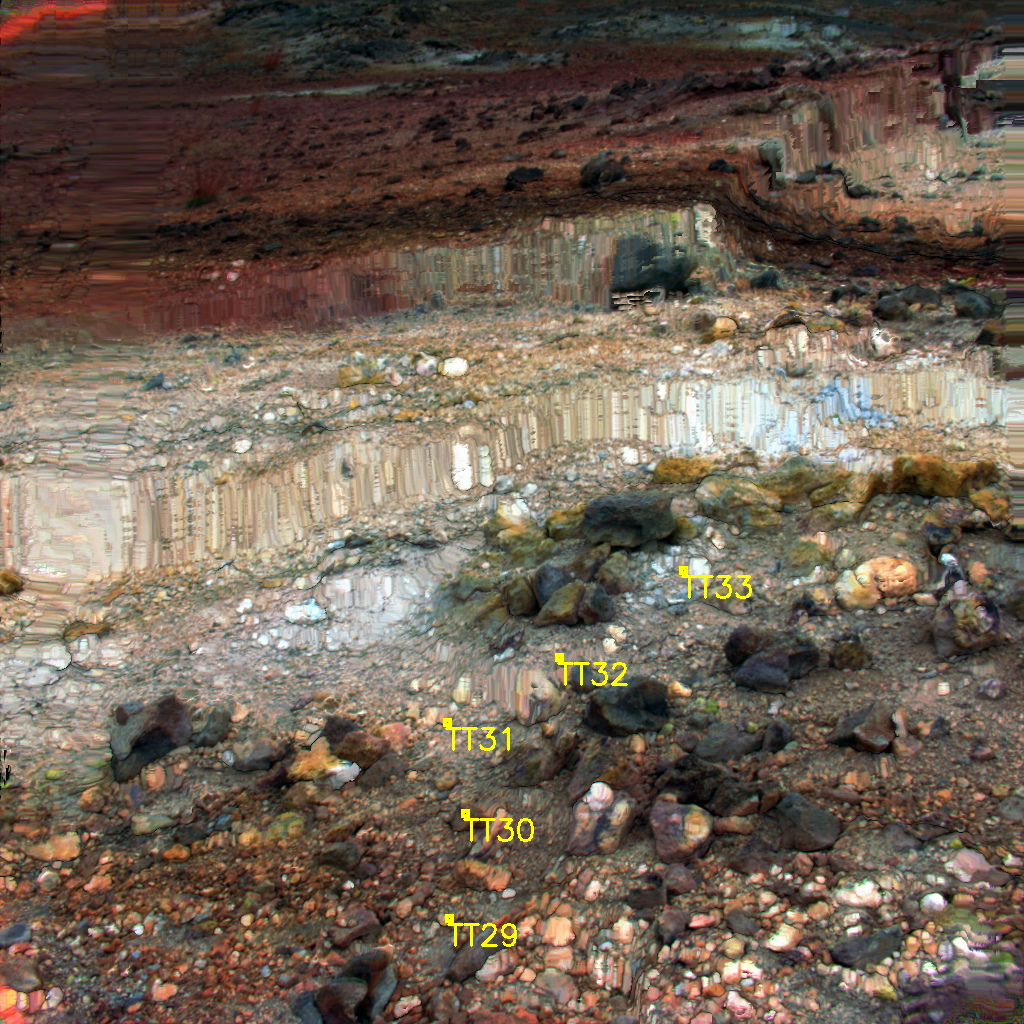
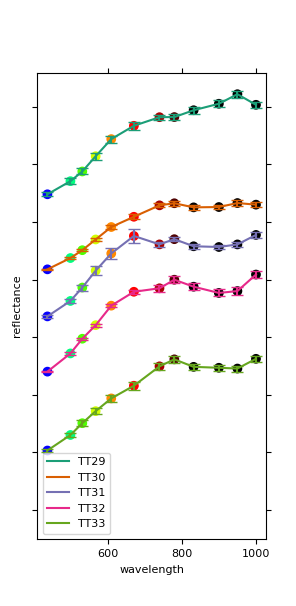
Viewing this data in the PCOT app lets us see how it was generated:
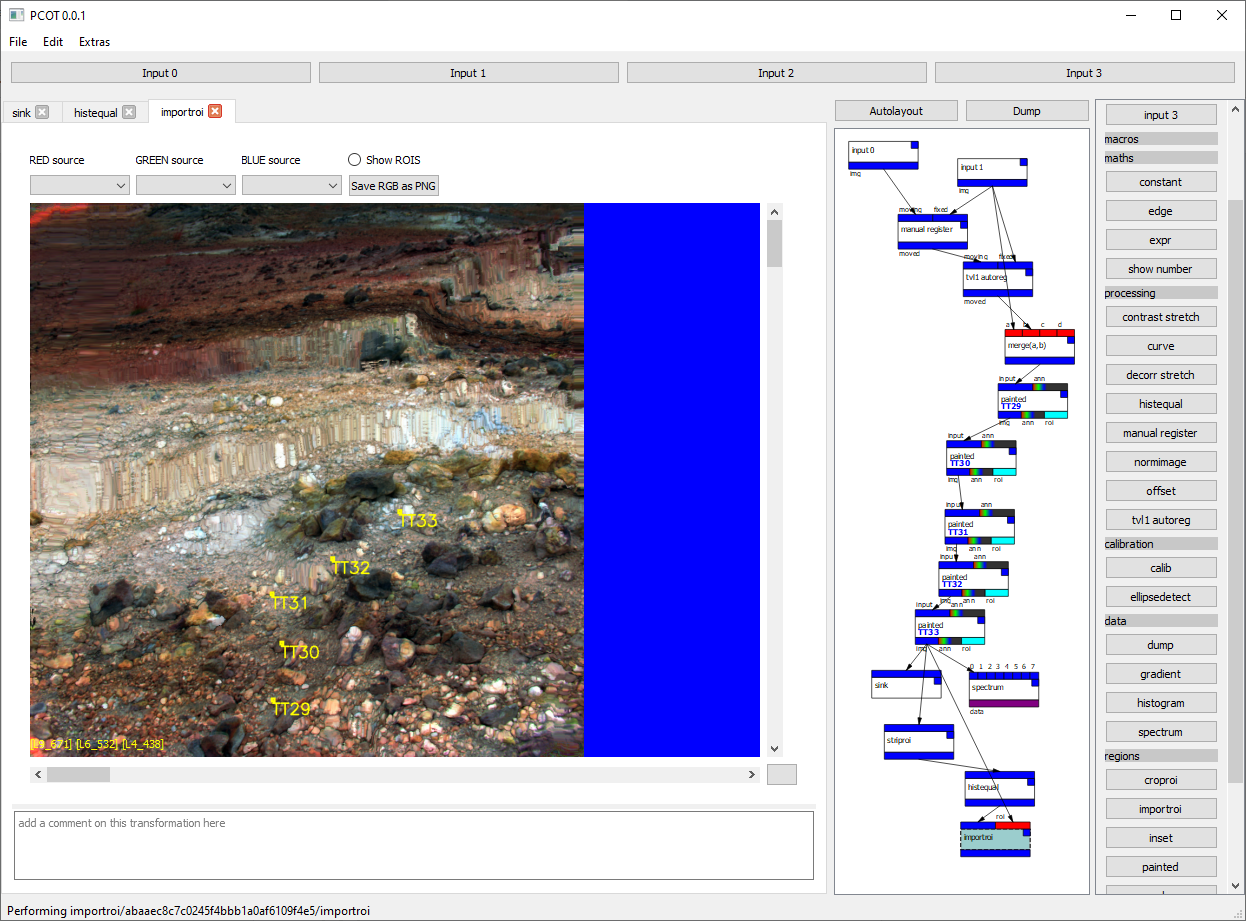
- We have two inputs from two separate images (left and right cameras)
- We register these manually, distorting the left camera image to match the right
- This is imperfect, so we also do the process automatically on the output of the manual registration. While this produces artifacts, it works well enough on the parts of the image in which we are interested.
- We merge the two images into a single image
- We then have a sequence of “painted” regions of interest added to the merged image
- We plot a spectrum of these images (as seen above)
- We then strip out the ROIs, perform a histogram equalisation on the whole image (normally it is confined to any ROIs), and then reimpose the ROIs onto the image for viewing. The output is the image shown above, and is also shown in the PCOT app view.
Calibration
Much of the PCOT work will be calibrating images. See here.