Lunar Digital Elevation Models:
By popular request, here are some Lunar digital
elevation models (DEMs) – sections of the planet wide 1 km / pixel DEM I
produced whilst I was working for the Smithsonian. Please note that in areas of
the Moon devoid of much surface texture e.g. dark mare areas, the stereo
matching software (Gotcha from University College London) works poorly,
resulting in much topographic noise. The early Apollos landed in such areas for
safety reasons (i.e. the topography was nice and flat) and consequently the
DEMs do not look very nice; the best one is Apollo 16. Also the way that the
Clementine spacecraft took nadir stereo imagery (it was not intended that
stereo would be taken this way, but some is present), there are many gaps in
stereo coverage – these show up as annoying black rectangles in the DEMs
and are just something we have to live with!
The DEMs are provided as GIF images (except for
the global version – this is a TIF) and are scaled from DN=0 (-9.6km) to
DN=255 (+9.6km), one DN level (grey level) will correspond to 75m in elevation.
The topographic datum (sea-level) used in these DEMs was a 1737.4km radius
sphere. There are a few DEMs where different height scales and E-W/N-S km/pixel
scales have been used, but these are mentioned in the appropriate sections
below. You should ignore DN=0 values as these also indicate no data.
<Q> What is a Planet-Wide Digital Elevation
Model?
<A> I use the term
“Planet-wide” rather than “Global” simply because there
are a lot of gaps in stereo coverage by the Clementine spacecraft giving rise
to a chess-board type of DEM with gaps. Unfortunately this is unavoidable due
to the way that the spacecraft took images in a non-staggered way from Polar
orbit. Although the DEM is at 1 km/pixel, if you want a global DEM you will
have to reduce the spatial resolution and interpolate over the gaps.
<Q> Is the DEM registered to the USGS UVVIS
image mosaic?
<A> Displacements have been found in longitude
and latitude between these two datasets. At 0W, 0N registration is better to
less than 1 km, but as we move towards the limb regions as seen from Earth,
regional spatial offsets of 1 to ~ 10km creep in, then start to vanish again on
the farside. Reasons: 1) The USGS UVVIS image mosaic was generated using a
photogrammetric control net by USGS/RAND which is tied to some Apollo lander
sites (precisely known locations) – these are close to the equator and
the center of the lunar disk as seen from Earth – a 1737.4km radius
sphere was used in this model at the time. However as we know now the Moon has
a ~+/-10 km topographic range across its surface and consequently spatial
offsets might have crept in? 2) The stereo DEMs were generated using pre-USGS
camera position and orientation data which was known to cause lon/lat offset
projection errors of images onto the surface of ~+/-1 km. Height offsets (not
lon/lat offets) resulting were corrected for as best we could by fitting to
absolute height laser altimeter points. Consequently neither dataset is perfect
and hence do not register together precisely. It illustrates the need for the
need to plan stereo-photogrammetric mapping well on future space missions! It
should be said though that Clementine mission was never intended to take stereo
images planet-wide, so the topographic information gained is a marvellous
bonus. Further information about the DEM Vs image mosaic registration problem
can be found in my 2002 publication list in:
The United States Geological Survey have
re-processed all my stereo matched data and re-configured their control network. At some point in the
near future I will fit my DEM tiles to this and the existing laser altimeter
points. Also science is still being done with the existing planet-wide DEM
version - looking for large scale structures not previously identified e.g.
pre-Nectarian impact basins.
DEMs…….
Global 1km/pixel – DEM (180W-180E, 90N-90S – 1 pixel is 1/30.32222 of a deg in lon and lat. Image 10916x54585 pixels in size. Please note that the checker-board like pattern of DEM tiles results from the way that Clementine images overlapped. There are also a few height tile offsets where there are bad LIDAR points or noise in the data. DN=0 is -9.6 km and DN=255 is +9.6 km. Each DN interval corresponds to 75 metres. DN=0 also infers 0 stereo data present or the height is <9.6 km. DN=255 could mean the height is at +9.6 km or exceeds this. The DEM height tiles here are fitted to LIDAR points. It turns out (according to the USGS) that the LIDAR points that I had used were not wrt a sphere of 1737.4 km, but with respect to an ellipsoid surface. More details about this later. Also please do not use DEM data in the region 90N-80N or 90S-80S as there were some fitting errors here. Far better to use the Lunar North and South polar DEMs below.
Lunar North Pole – DEM (1800x1800 in size covering 60N-90N
in latitude, presented in polar stereographic projection, 90W is on the left,
90E is on the right, 180W is at the top) and UVVIS mosaic.
DN=0 is –9.6km and DN=255 is +9.6 km (Note a 1737.4 km radius topographic
datum or sea-level was used here) or 75m per DN brightness level. Note that
DN=0 also signifies missing data due to gaps in stereo coverage, shadowed areas
etc. Full details about this DEM can be found in: Cook, A.C., Watters, T.R.,
Robinson, M.S., Spudis, P.D., and Bussey, D.B.J., (2000): Lunar Polar
Topography derived from Clementine Stereo Images, Journal of Geophysical
Research, 105(E5), pp12023-12033. For a USGS version DEM of the south pole see:
http://astrogeology.usgs.gov/Teams/Geomatics/photogrammetry/topography_lunar.html
Lunar South Pole – DEM (1800x1800 in size covering 60N-90N
in latitude, presented in polar stereographic projection, 90W is on the left,
90E is on the right, 180W is at the bottom) and UVVIS mosaic.
DN=0 is –9.6km and DN=255 is +9.6 km (Note a 1737.4 km radius topographic
datum or sea-level was used here) or 75m per DN brightness level. Note that
DN=0 also signifies missing data due to gaps in stereo coverage, shadowed areas
etc.Full details about this DEM can be found in: Cook, A.C., Watters, T.R.,
Robinson, M.S., Spudis, P.D., and Bussey, D.B.J., (2000): Lunar Polar
Topography derived from Clementine Stereo Images, Journal of Geophysical
Research, 105(E5), pp12023-12033. For a USGS version DEM of the south pole see:
http://astrogeology.usgs.gov/Teams/Geomatics/photogrammetry/topography_lunar.html
Mare Orientale – DEM (120W-65W, 0S-40S) and USGS
Clementine mosaic.
“The DEM was obtained stereo matching several thousands of Clementine
UVVIS image pairs using the UCL Gotcha stereo matcher. DN=0 is –6.4km and
DN=255 is +6.4 km (Note a 1737.4 km (probably, else 1738.0km) radius
topographic datum or sea-level was used here) or 50m per DN brightness level.
Note that DN=0 also signifies missing data due to gaps in stereo coverage,
shadowed areas etc. You may well see that if you overlay the USGS image mosaic
on the DEM there are spatial offsets. This discrepancy is discussed in: Cook, A.C.,
Robinson, M.S., Semenov, B., and Watters, T.R., (2002): Preliminary Analysis of
the Absolute Cartographic Accuracy of the Clementine UVVIS Mosaics, American
Geophysical Society, AGU Fall Meeting, San Francisco, 83, 47, ppF869. Section
P22D-0. & Cook, A.C., Semenov, B., Robinson, M.S., and Watters, T.R.
(2002): Assessing the Absolute Positional Accuracy of the Clementine UVVIS Mosaic.
Proceedings of the 36th Vernadsky-Brown Microsymposium,
Luna 9, 13 – DEM (70W-60W, 0N-20N) and UVVIS mosaic – 1 pixel is 1/30.32222 of a
deg in lon and lat. Image 303x606 pixels in size. This region is home to no
less than 2 Soviet Luna landers: Luna 9 located at 63.37W, 7.08N or
S=171,L=392, and Luna 13, located at 62.05W, 18.87N or S=241, L=34. Unfortunately
neither landing site is located on a DEM tile. The quality of the DEM is poor
anyway due to the large amount of low texture mare material in the area.
However several craters are visible.
Apollo 11 – DEM (17E-27E, 5S-5N) and UVVIS mosaic – 1 pixel is 1/30.32222 of a
deg in lon and lat. Image 303x303 pixels in size. Landing site of Apollo 11
located at 23.47297E, 0.67408N or S=196, L=144. Note that there are no DEM
tiles matched at the landing site because the stereo matcher found the texture
of the images too dark and smooth. However there is at least some highland
topography to the south.
Apollo 12 – DEM (28W-18W, 2N-8S) and UVVIS mosaic – 1 pixel is 1/30.32222 of a
deg in lon and lat. Image 303x303 pixels in size. Landing site of Apollo 12
located at 23.42157W, 3.01239S or S=139, L=152. Note that there are no DEM
tiles matched at the landing site because the stereo matcher found the texture
of the images too dark and smooth. At most 3 crater (parts) are recognizable in
the DEM, and you are probably better off using the smoothed LIDAR DEM from the
Apollo 14 – DEM (22W-12W, 1N-9S) and UVVIS mosaic – 1 pixel is 1/30.32222 of a
deg in lon and lat. Image 303x303 pixels in size. Landing site of Apollo 14
located at 17.47136W, 3.64530S or S=137, L=141. At last we find that the Apollo
landing site sits on a DEM tile, however as the site is flat and safe, there is
not much to see here! A few craters and large ring crater structures are
visible elsewhere on the DEM. This area suffers from some instances of bad
laser altimeter points – resulting in DEM tile offsets in a few places.
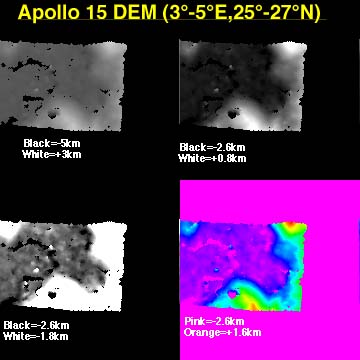
Apollo 15 – DEM (1W-9E, 21N-31N) and UVVIS mosaic – 1 pixel is 1/30.32222 of a
deg in lon and lat. Image 303x303 pixels in size. Landing site of Apollo 15
located at 3.63386E, 26.13222N or S=141, L=148. Probably one of the worst
Clementine nadir stereo coverage areas of the Apollo landing sites. The good
news though is that the highland area on the east does show up in the DEM where
stereo overlap is present. There is an alternative DEM available produced by a
more semi-automated approach to stereo matching tilted Clementine images this
covers the region 3E-5E, 25N-27N and can be seen by clicking here.
Apollo 16 – DEM (10E-20E, 4S-14S) and UVVIS mosaic – 1 pixel is 1/30.32222 of a
deg in lon and lat. Image 303x303 pixels in size. Landing site of Apollo 16
located at 15.50019E, 8.97301AS or S=167, L=151. This is a reasonably good DEM
for a near equatorial site and the landing site lies within a rectangular DEM
tile.
Apollo 17 & Luna 21
– DEM
(20E-40E, 15N-30N) and UVVIS mosaic
– 1 pixel is 1/30.32222 of a deg in lon and lat. Image 606x455 pixels in
size. Landing site of NASA’s Apollo 17 located at 30.77168E, 20.19080N or
S=327, L=297. Landing Site of the Soviet Luna 21 (Lunohkod 2) 30.45E, 25.85N or
S=317, L=126. Neither landing site lies on a DEM tile. The mare area to the
right is noisy for reasons explained above, but elsewhere the highland areas
come out well.
Global – DEM (180W-180E, 90N-90S – 1 pixel is 1/30.32222 of a deg in lon and lat. Image 10916x54585 pixels in size. Please note that the checker-board like pattern of DEM tiles results from the way that Clementine images overlapped. There are also a few height tile offsets where there are bad LIDAR points or noise in the data. DN=0 is -9.6 km and DN=255 is +9.6 km. Each DN interval corresponds to 75 metres. DN=0 also infers 0 stereo data present or the height is <9.6 km. DN=255 could mean the height is at +9.6 km or exceeds this. The DEM height tiles here are fitted to LIDAR points. It turns out that these were quoted with respect to an ellipsoid surface. More details about this later. Also please do not use DEM data in the region 90N-80N or 90S-80S as there were some fitting errors here. Far better to use the Lunar North and South polar DEMs below.
Luna 16, 20, 24 (Mare Crisium) – DEM (45E-75E, 10E-30N) and UVVIS mosaic – 1 pixel is 1/30.32222 of a
deg in lon and lat. Image 910x1213 pixels in size. This region is home to no
less than 3 Soviet Luna sample return landers: Luna 16 located at 56.3E, 0.68S
or S=343,L=930, Luna 20, located at 56.50E,3.57N or S=349, L=801, and Luna 24,
62.20E, 12.25N or S=522, L=538. The quality of the DEM is not too bad
considering most of the stereo coverage is chess-board like at equatorial
latitudes anyway. The mare area floor of Mare Crisium has some problems with
many missing DEM tiles, but the surrounding highlands are covered as well as
can be expected. The Luna 16 and 20 lie outside DEM tiles, Luna 20 lies on the
edge of a tile.
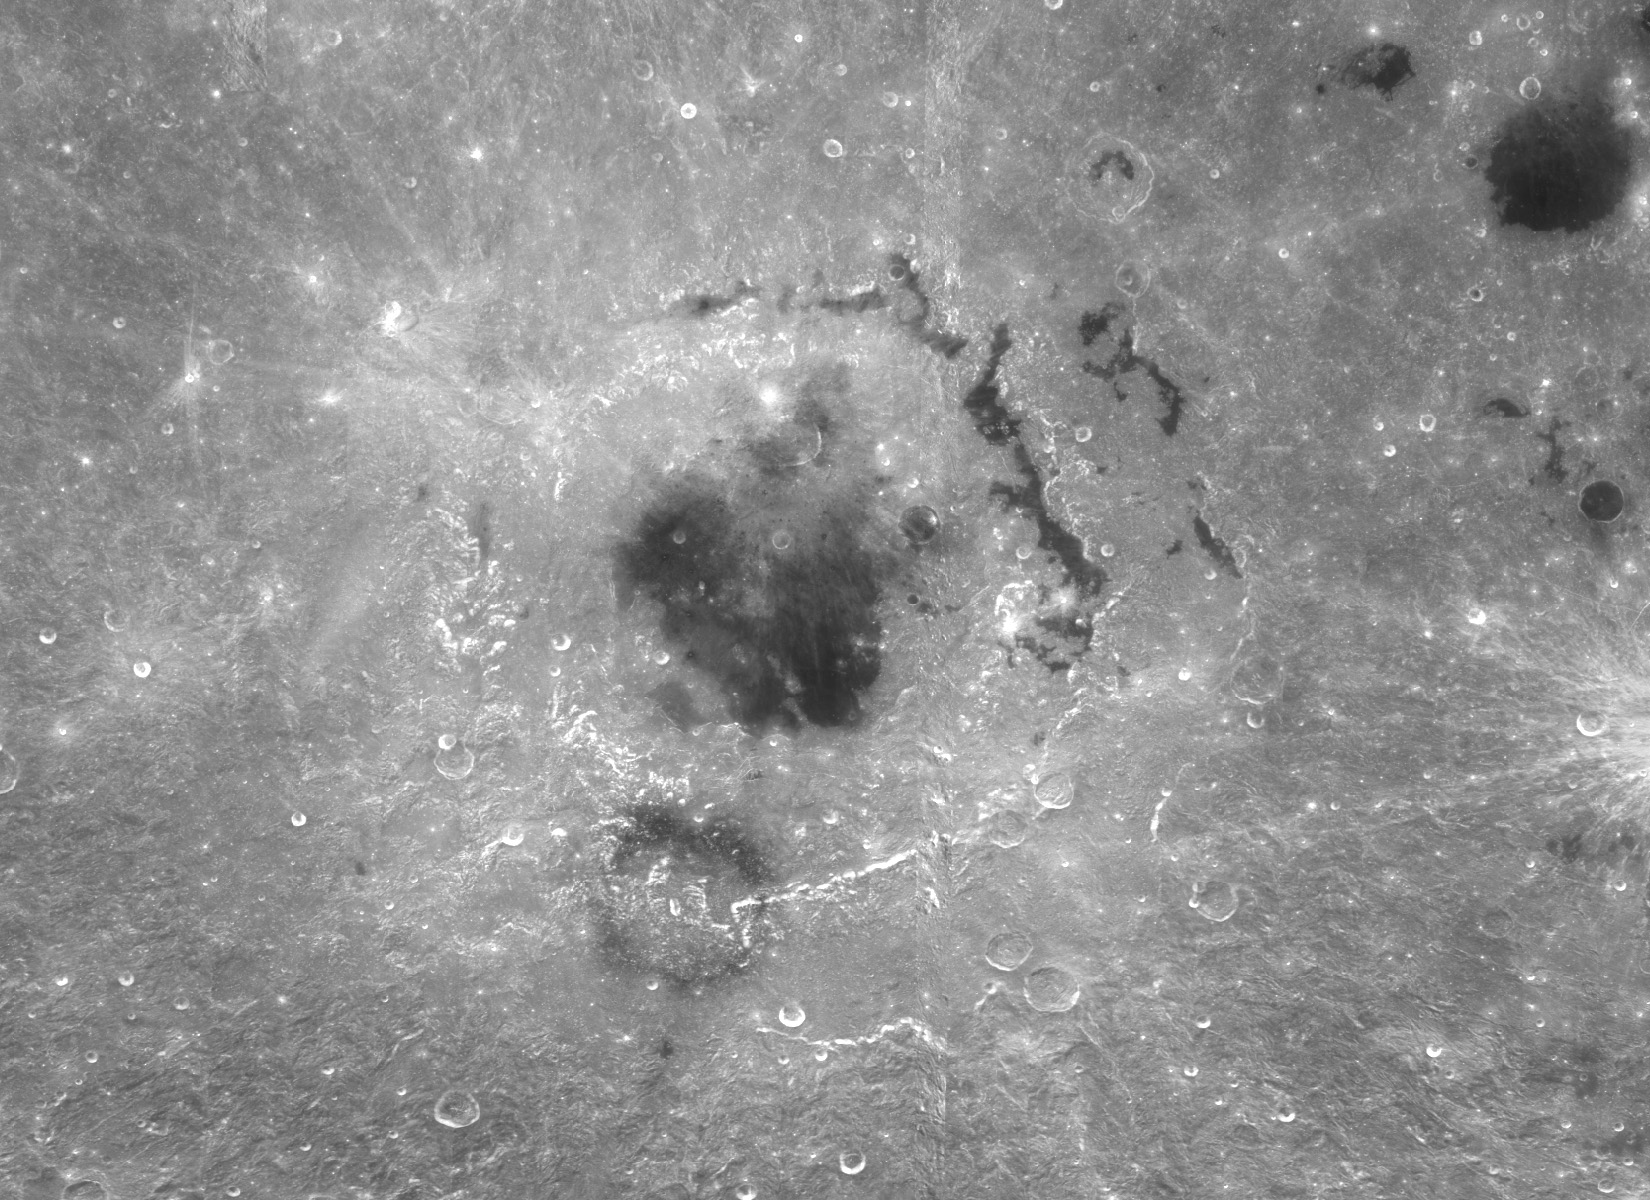
Copernicus – DEM (25W-15W, 15N-5N) and UVVIS mosaic – 1 pixel is 1/30.32222 of a
deg in lon and lat. Image 303x303 pixels in size. Copernicus is a fairly well
known crater about 95km in diameter on the nearside of the Moon. For
non-science folks interested in computer animation, a more complete, but
earlier and noisier DEM can be found by clicking here.
The stretching of this DEM goes from DN=255 (+6.4 km) to DN=0 (-6.4 km), with
one DN brightness level corresponding to 50m. The image scale of this DEM is
different too and is 1/30th of a deg per pixel and covers (30W-10W,
20N-0N). Although this earlier DEM has its faults, it might still be useful for
animators once you have cleaned up the noise and removed badly offset DEM tile
rectangles.
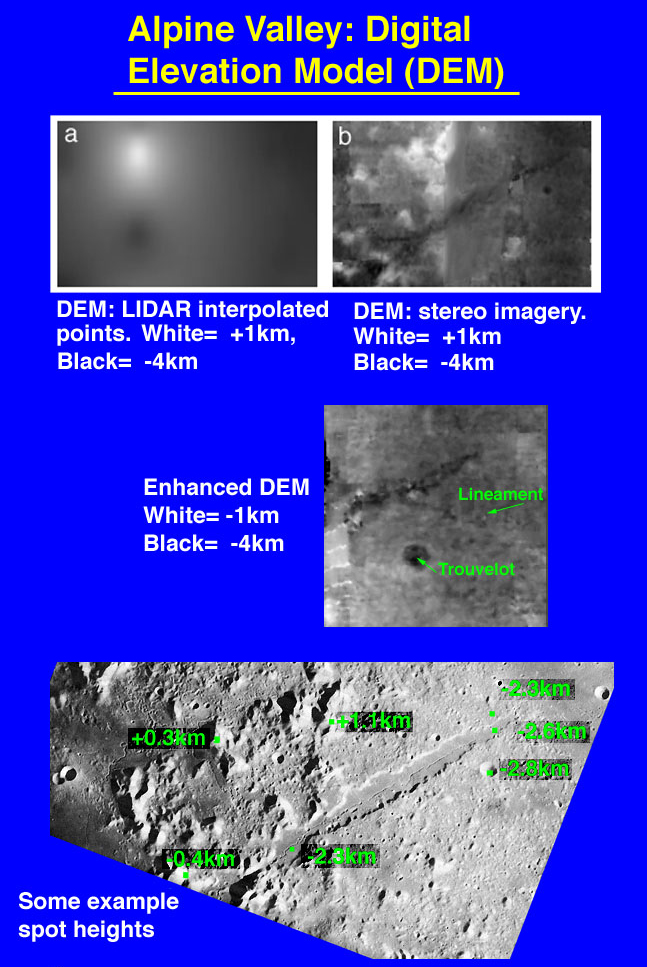
Plato, Cassini, Alpine Valley etc – DEM (15W-15W, 55N-35N) and UVVIS mosaic – 1 pixel is 1/30.32222 of a
deg in lon and lat. Image 910x616 pixels in size. Plato is a flat floor lava
flooded crater – the DEM suggests some topography but this is due to
problems with the stereo matcher working in dark low textured areas. For
non-science folks interested in computer animation, a more complete, but
earlier DEM of the Alpine Valley area (utilizing low resolution slanted
stereo images can be found by clicking here.
Unfortunately this was made such a long time ago, that I have lost details of
the corner lon/lat limits, scale, and DN stretch i.e. it does not go from
–9.6 to +9.6km; however it might still be useful for animator. Folks
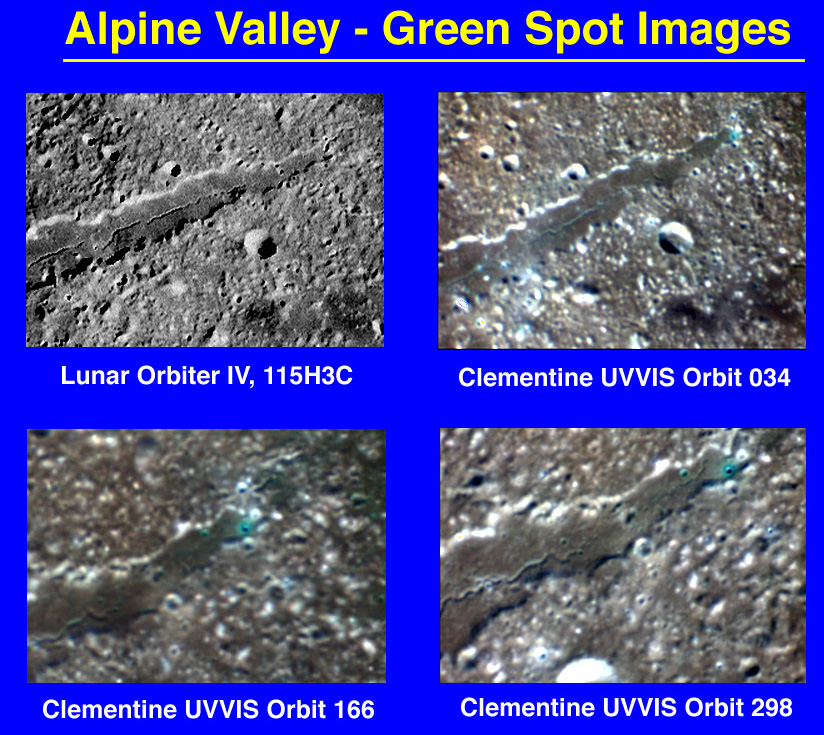
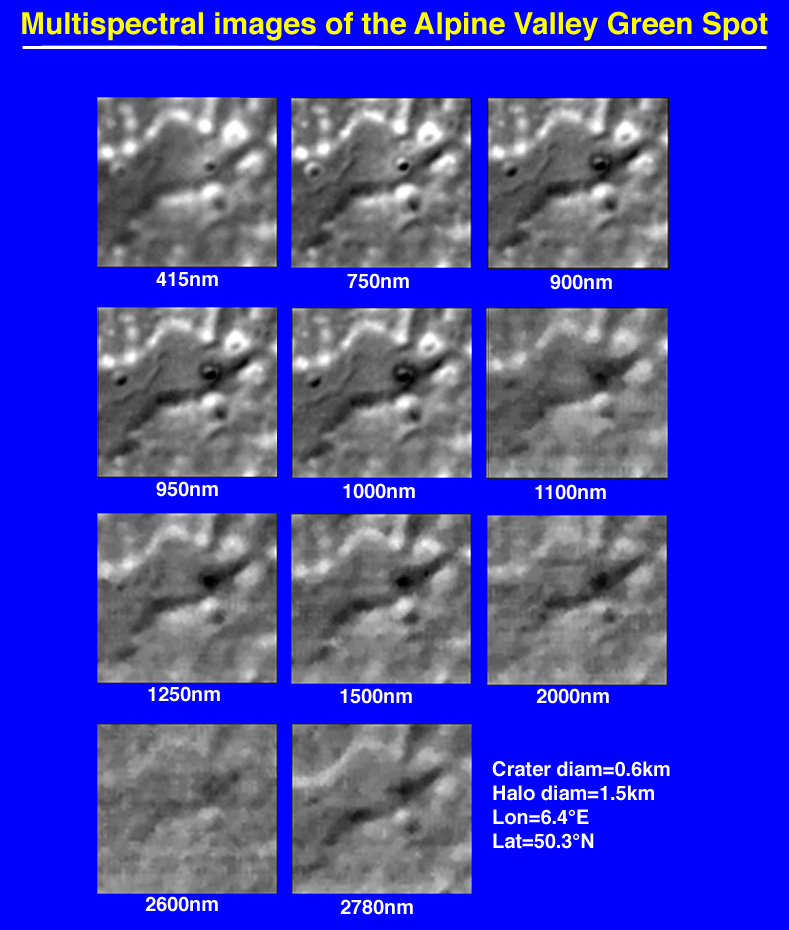
might also be interested to know that at the north end of the Alpine Valley as
a halo crater that is bright in the visible, but dark in the infrared.
Reason – the impactor was sufficiently large to puncture into a dark
layer beneath the Alpine valley floor, excavating this. Smaller craters do not
puncture deep enough to create this effect. False colour images utilizing the
blue, red, and near IR give this crater a false “greenish”
cast – possibly if you saw it in natural light it might look
slightly bluish? For a representation at all wavelengths captured from
Clementine see: here.
Alphonsus and Ptolemeaus – DEM (10W-0W, 20S-10S) and UVVIS mosaic – 1 pixel is 1/30.32222 of a
deg in lat and 1/29.3th of a deg per pixel in lon (i.e. 1x1km per pixel). The
Image 293x303 pixels in size and DN=0 is –5km and DN=255 is +1.4 km (Note
a 1738 km radius topographic datum or sea-level was used here) or 25m per DN brightness
level.
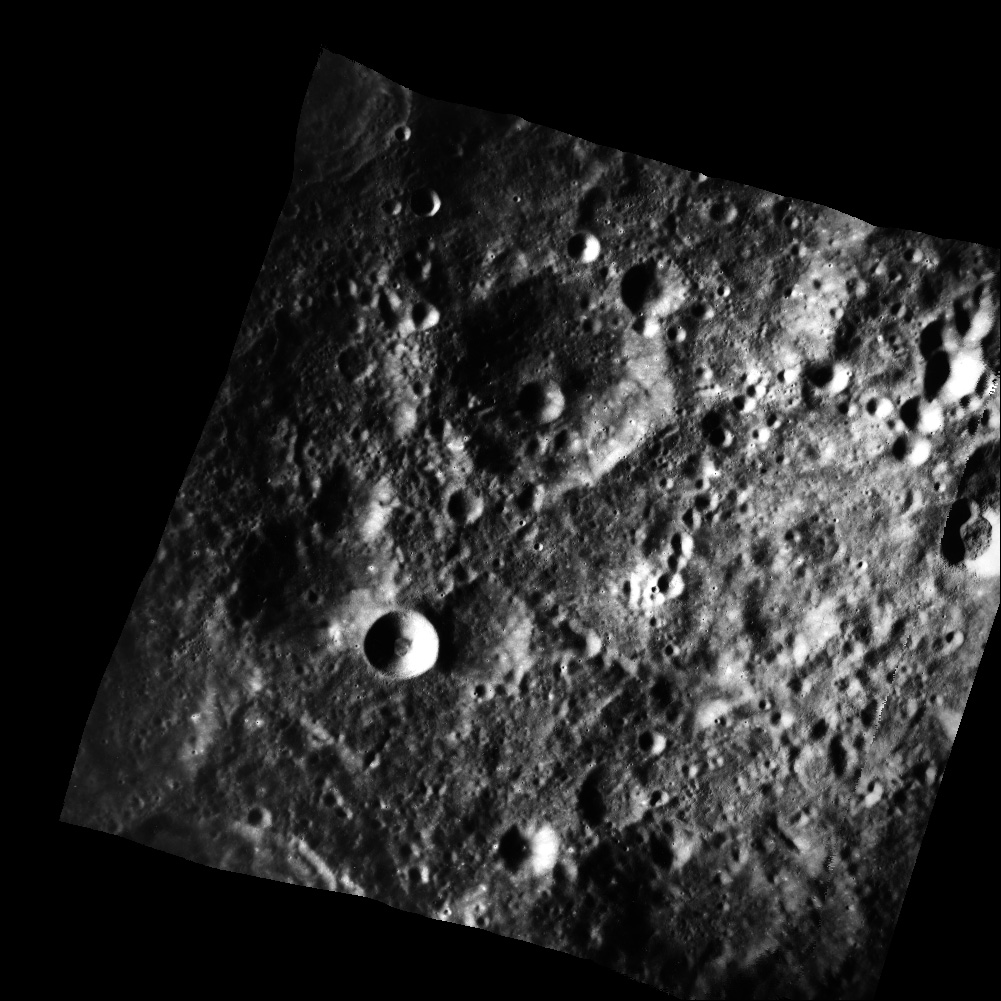
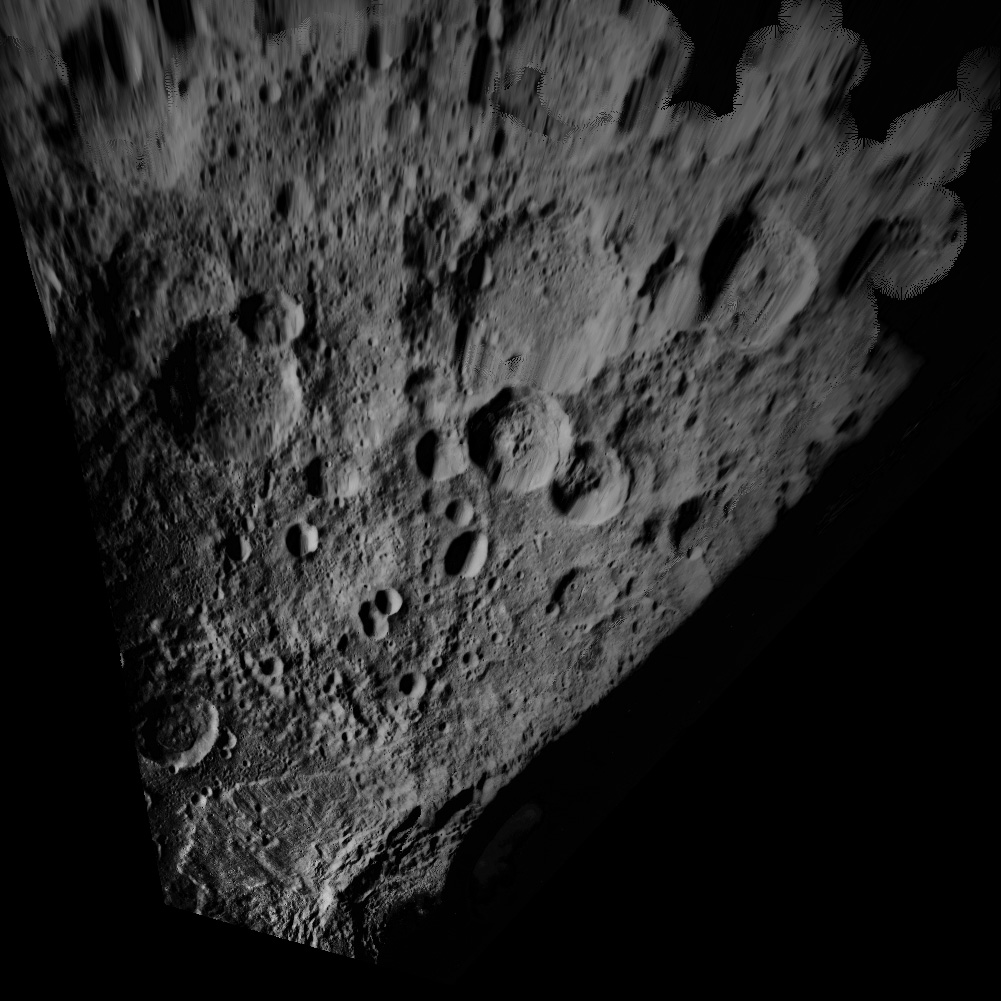
Tsiolkovsky Crater West Rim (High Resolution)
- crater DEM
(121E-129E, 14.5S-22.5S) and Metric photo.
The DEM was obtained from Apollo 15 Metric camera stereo pair 891 and 892. The
DEM is 1001x1001 in size and covers an area 8x8 deg, so each pixel is 8/1001th
of a deg or ~240m/pixel. The heights have been scaled from –11km (DN=0)
to +9km (DN=255) or 78.125m per DN level. For science use, please avoid using
the DEM less than one corner radius away from the terrain edges as this region
was extrapolated. Indeed the Apollo Metric photo clips well before this.
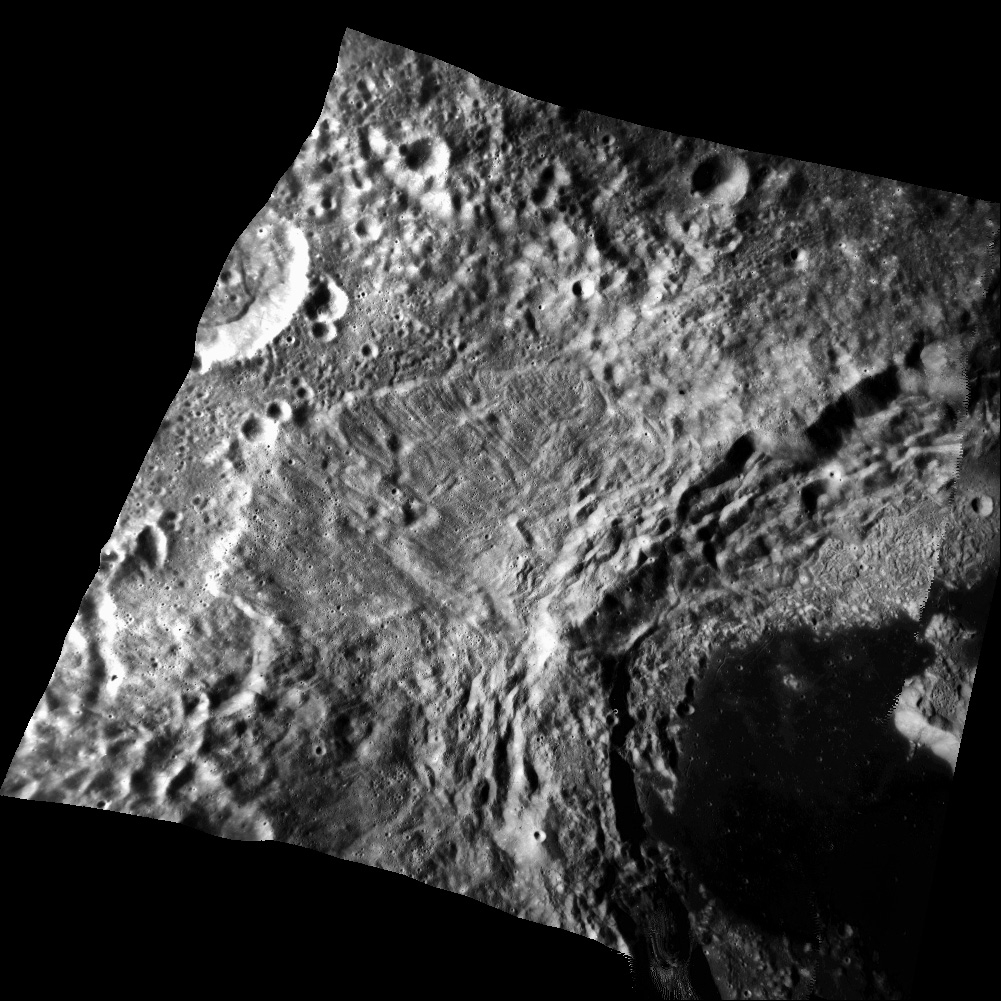
Tsiolkovsky Crater West Rim and the region to
West and North (Wide Angle) – DEM
(120E-136E, 5S-21S) and Metric photo.
The DEM was obtained from “oblique view” Apollo 15 Metric camera
stereo pair 1445 and 1446. The DEM is 1001x1001 in size and covers an area
16x16 deg, so each pixel is 2/125th of a deg or ~480m/pixel. The heights have been
scaled from –6km (DN=0) to +6km (DN=255) or 23.4375m per DN level. Note
that DN=255 refers to no data instead of the more usual DN=0. Due to
distortions present in the film, and the oblique view geometry, this DEM should
definitely not be used for science! Even animation use should be careful of the
apparent >6km high E-W ridge located at S=292, L=667, which is an
artifact of the film distortion! Also please avoid using the DEM less than one
corner radius away from the terrain edges as this region was extrapolated.
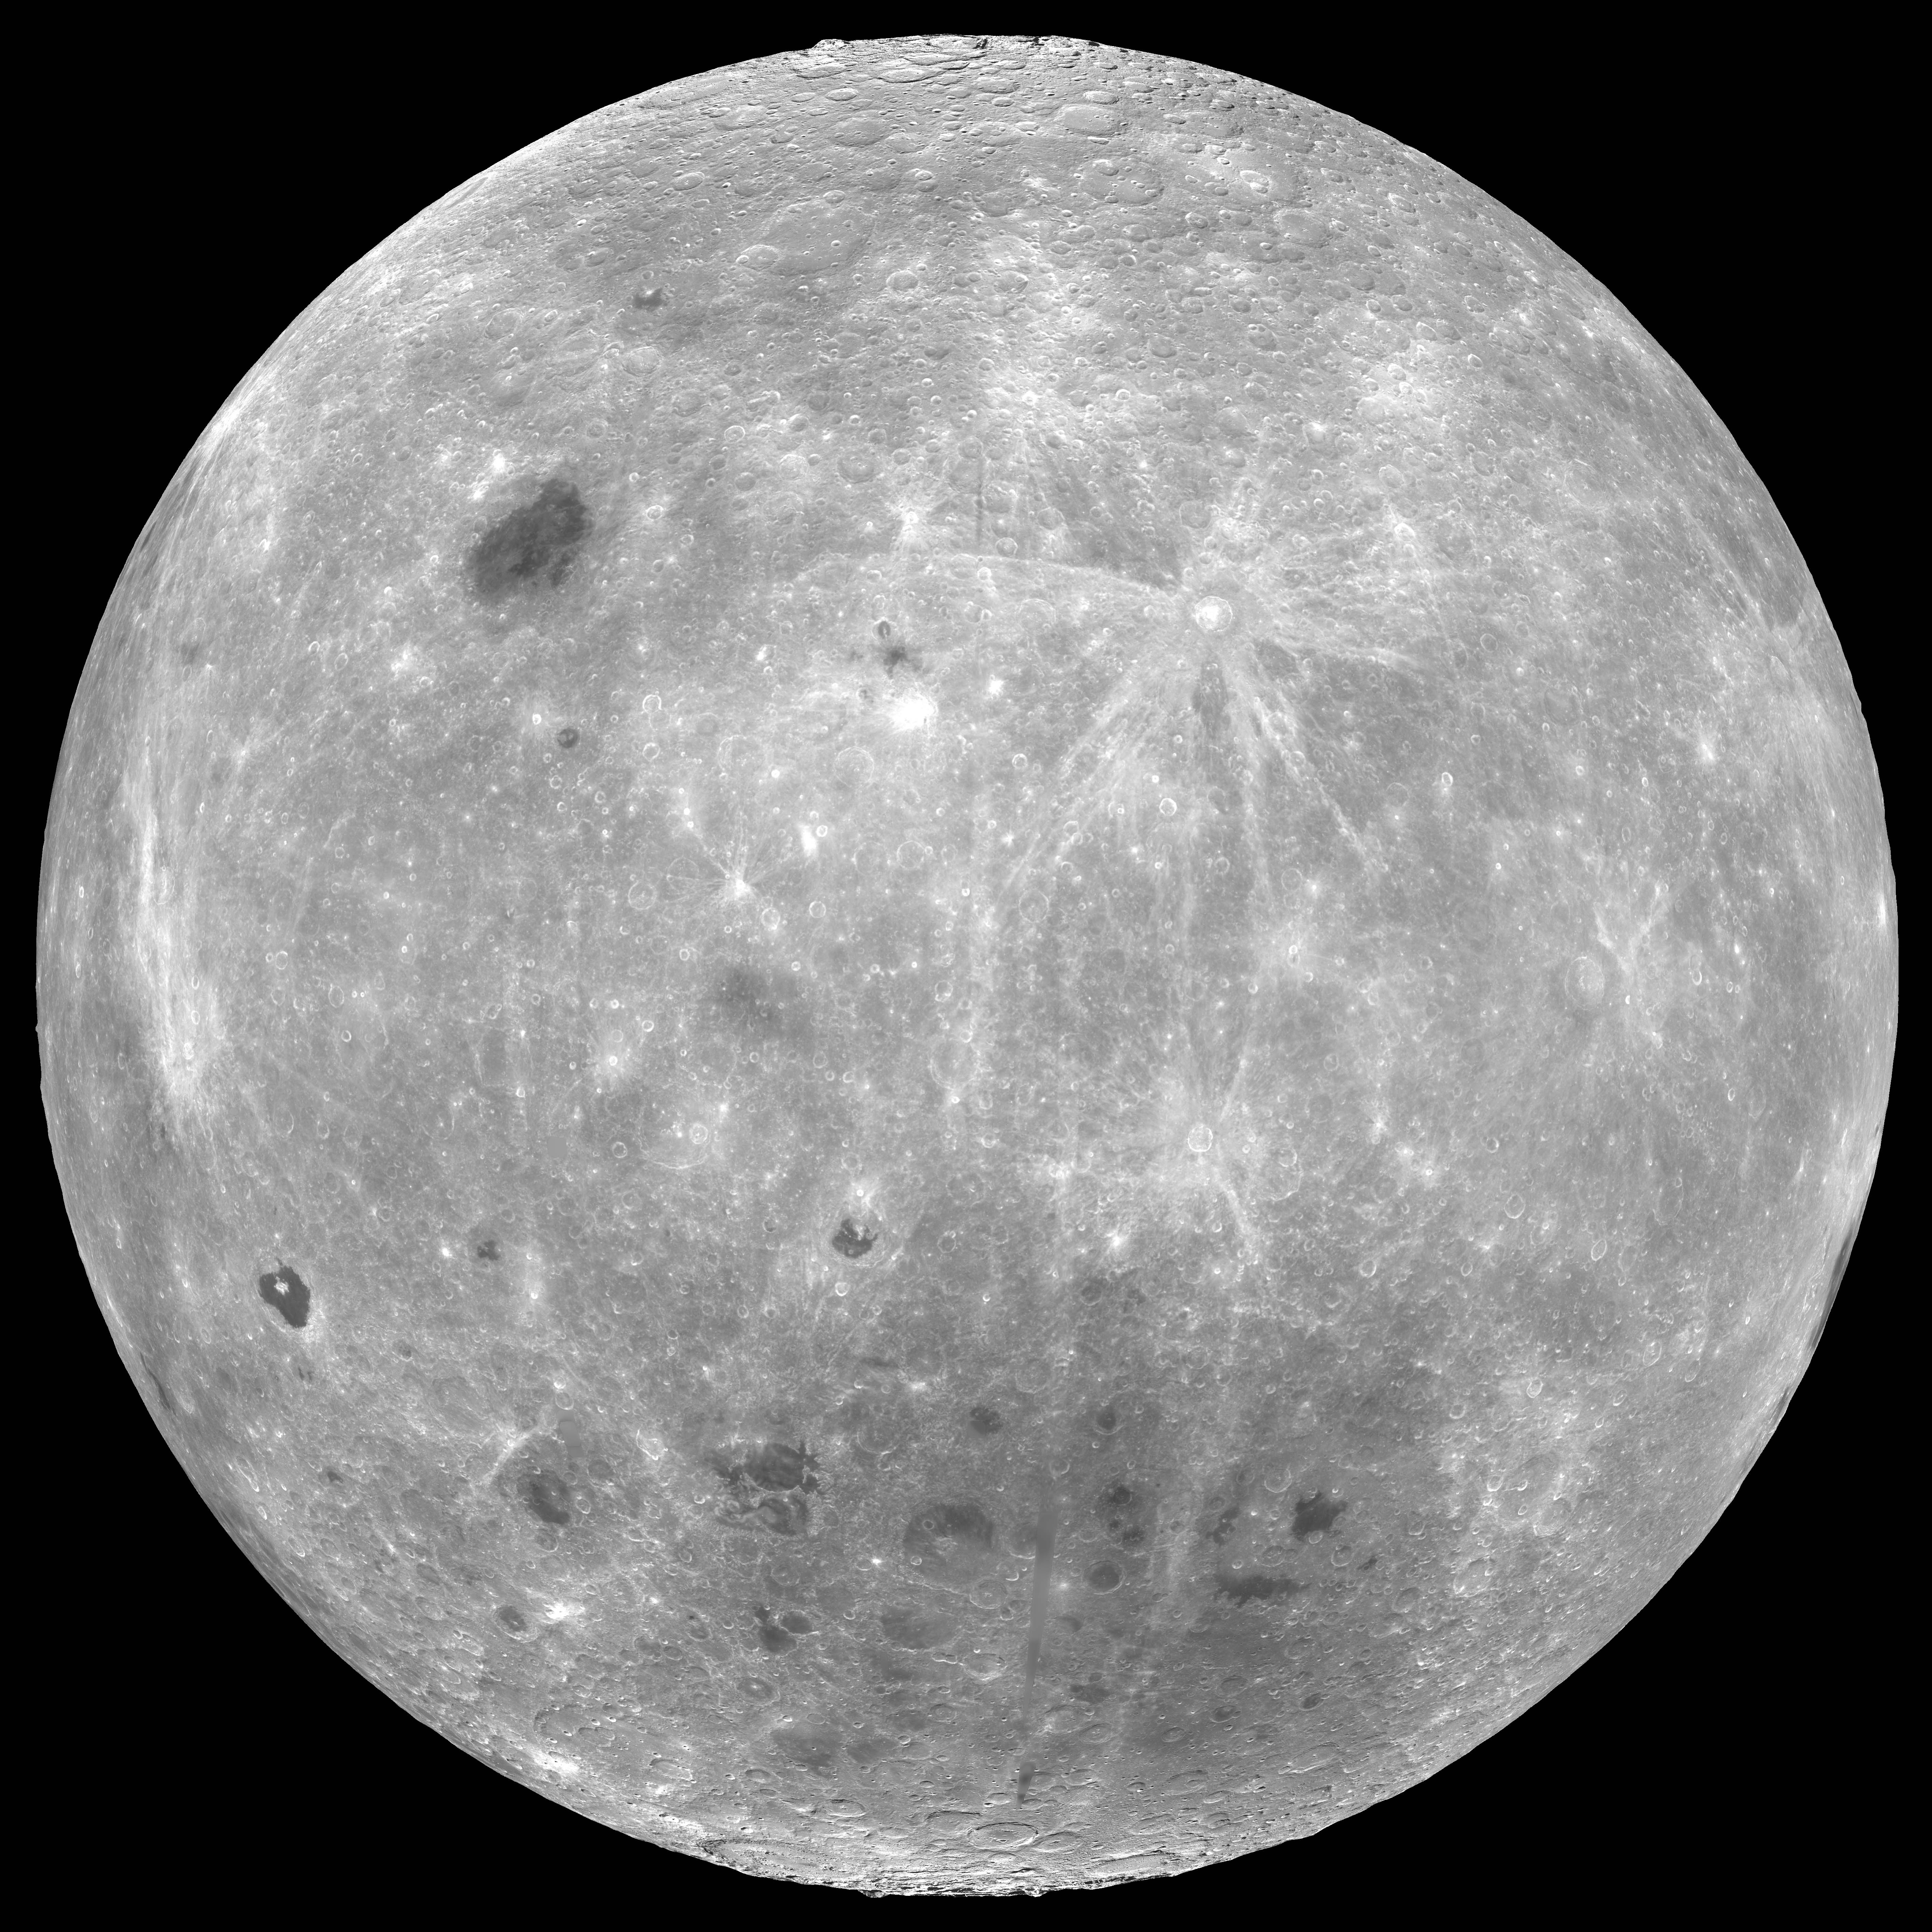
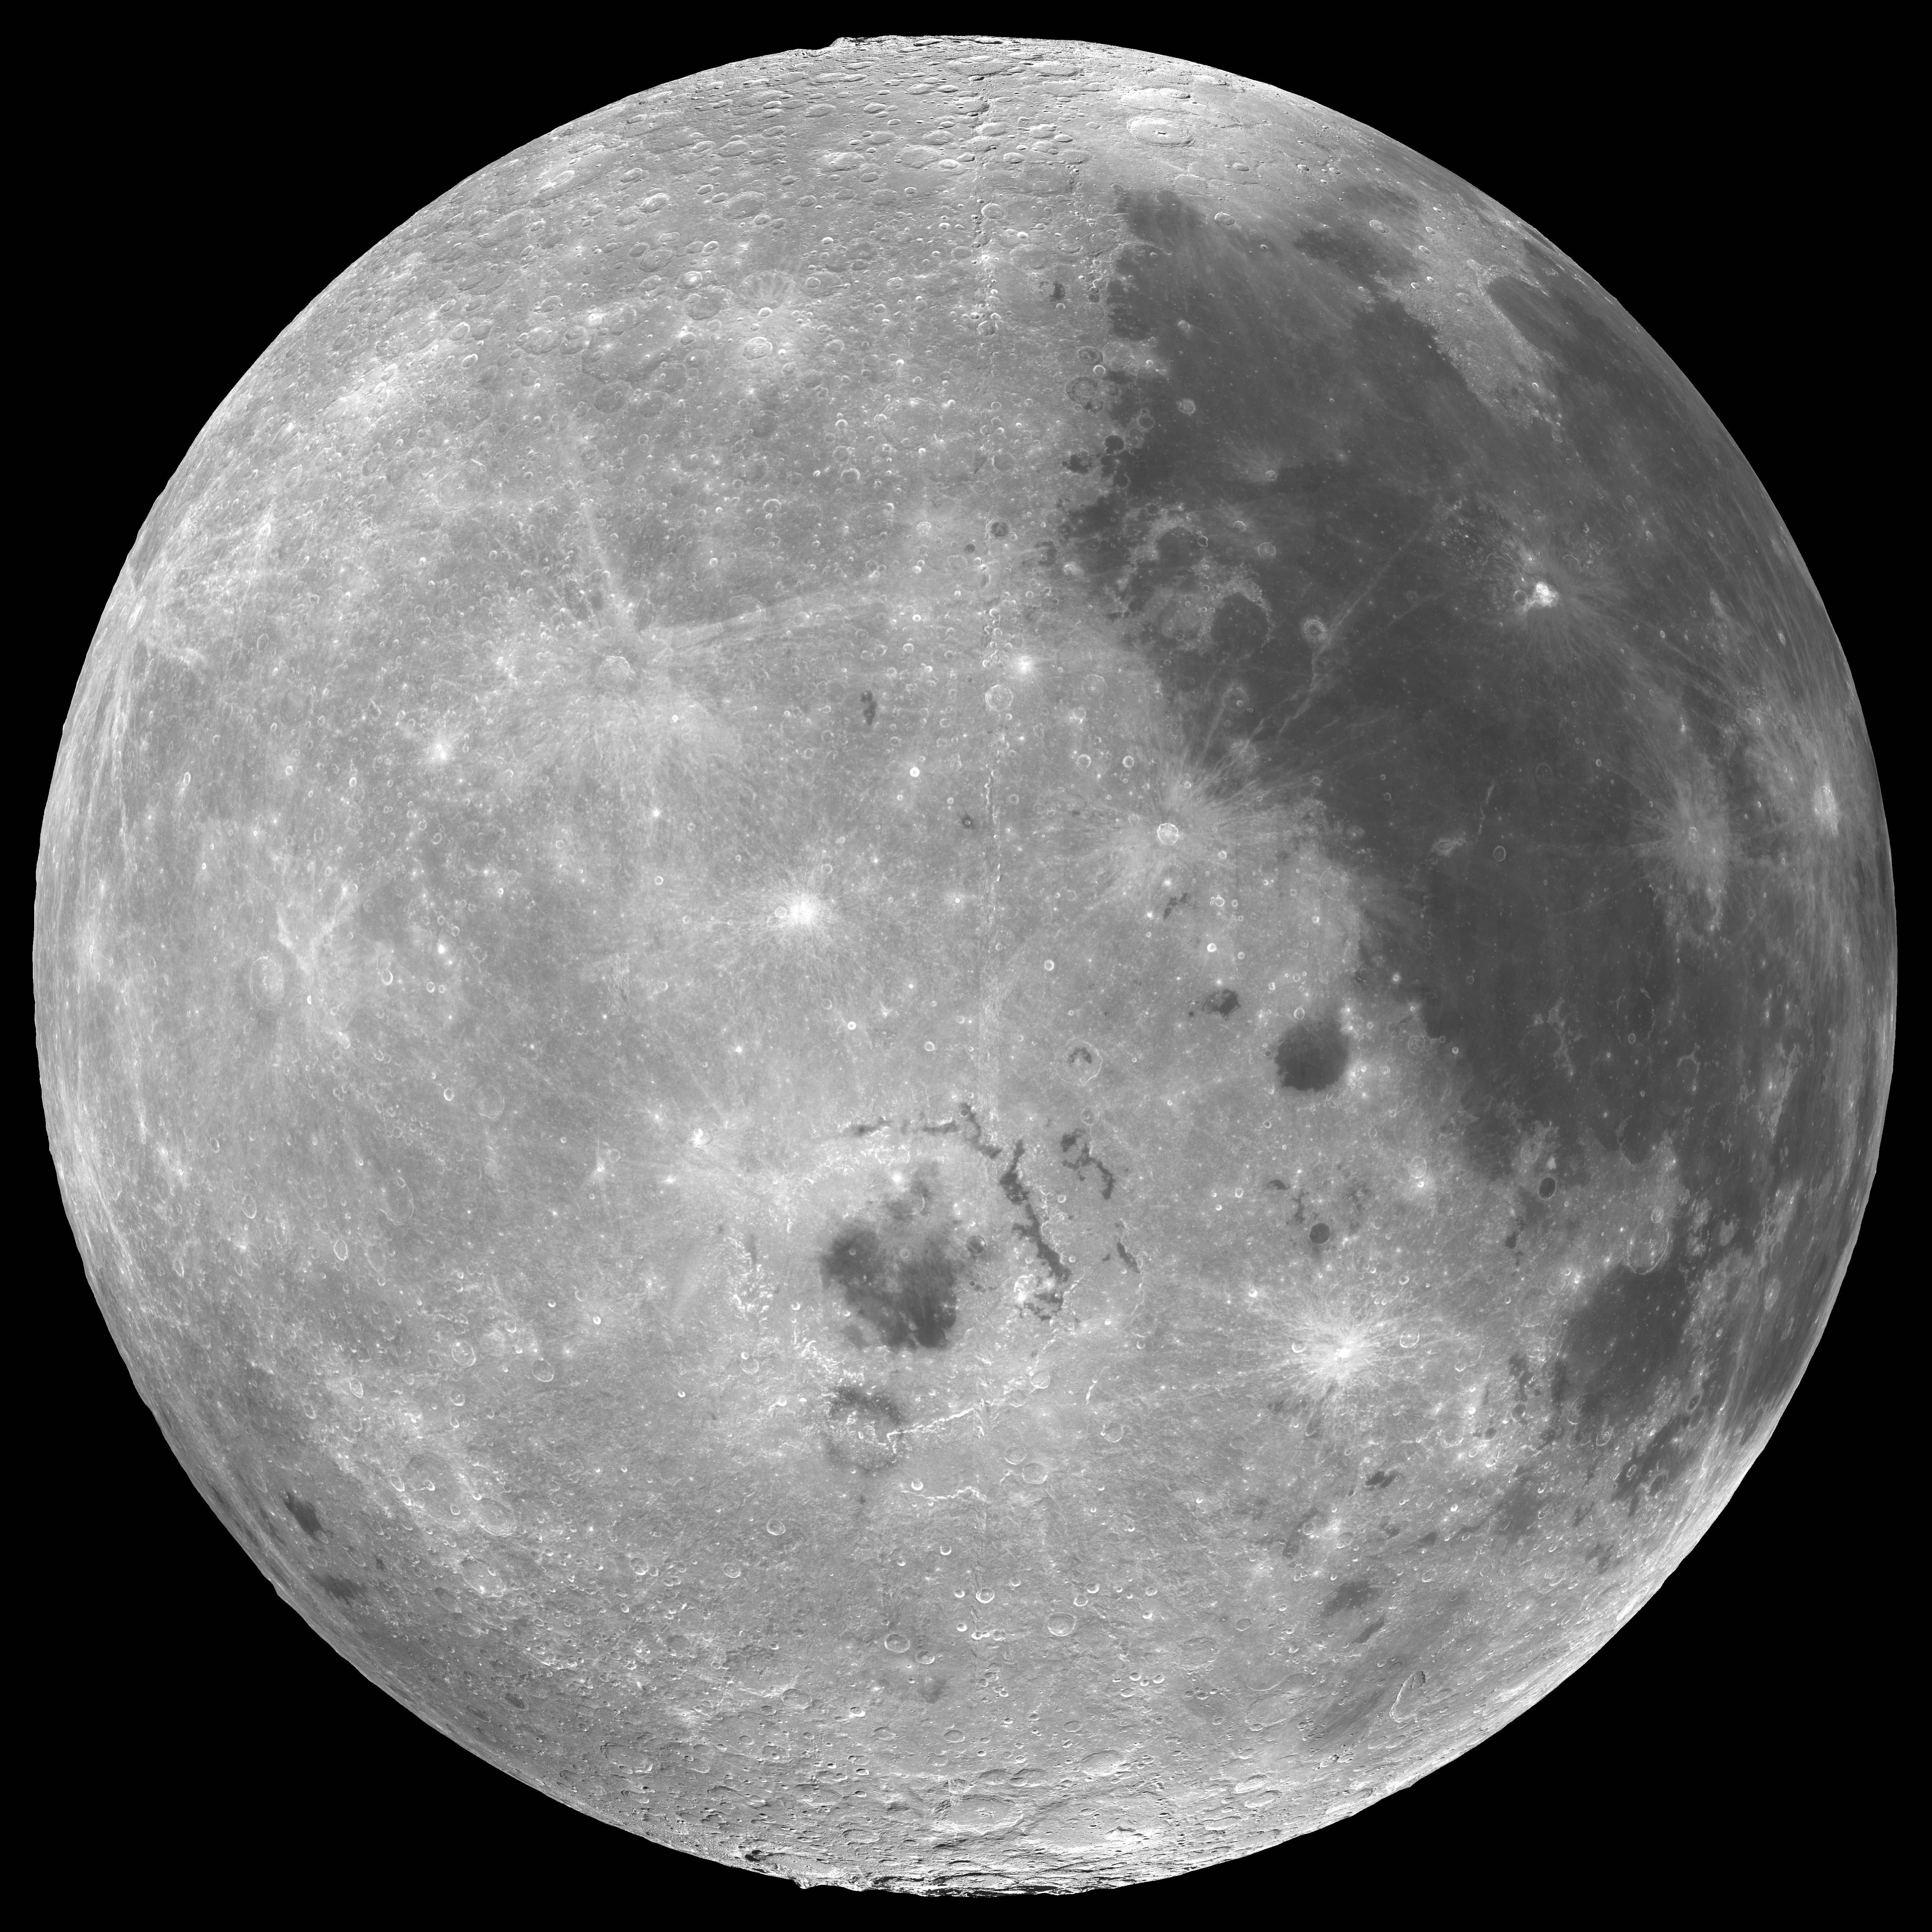
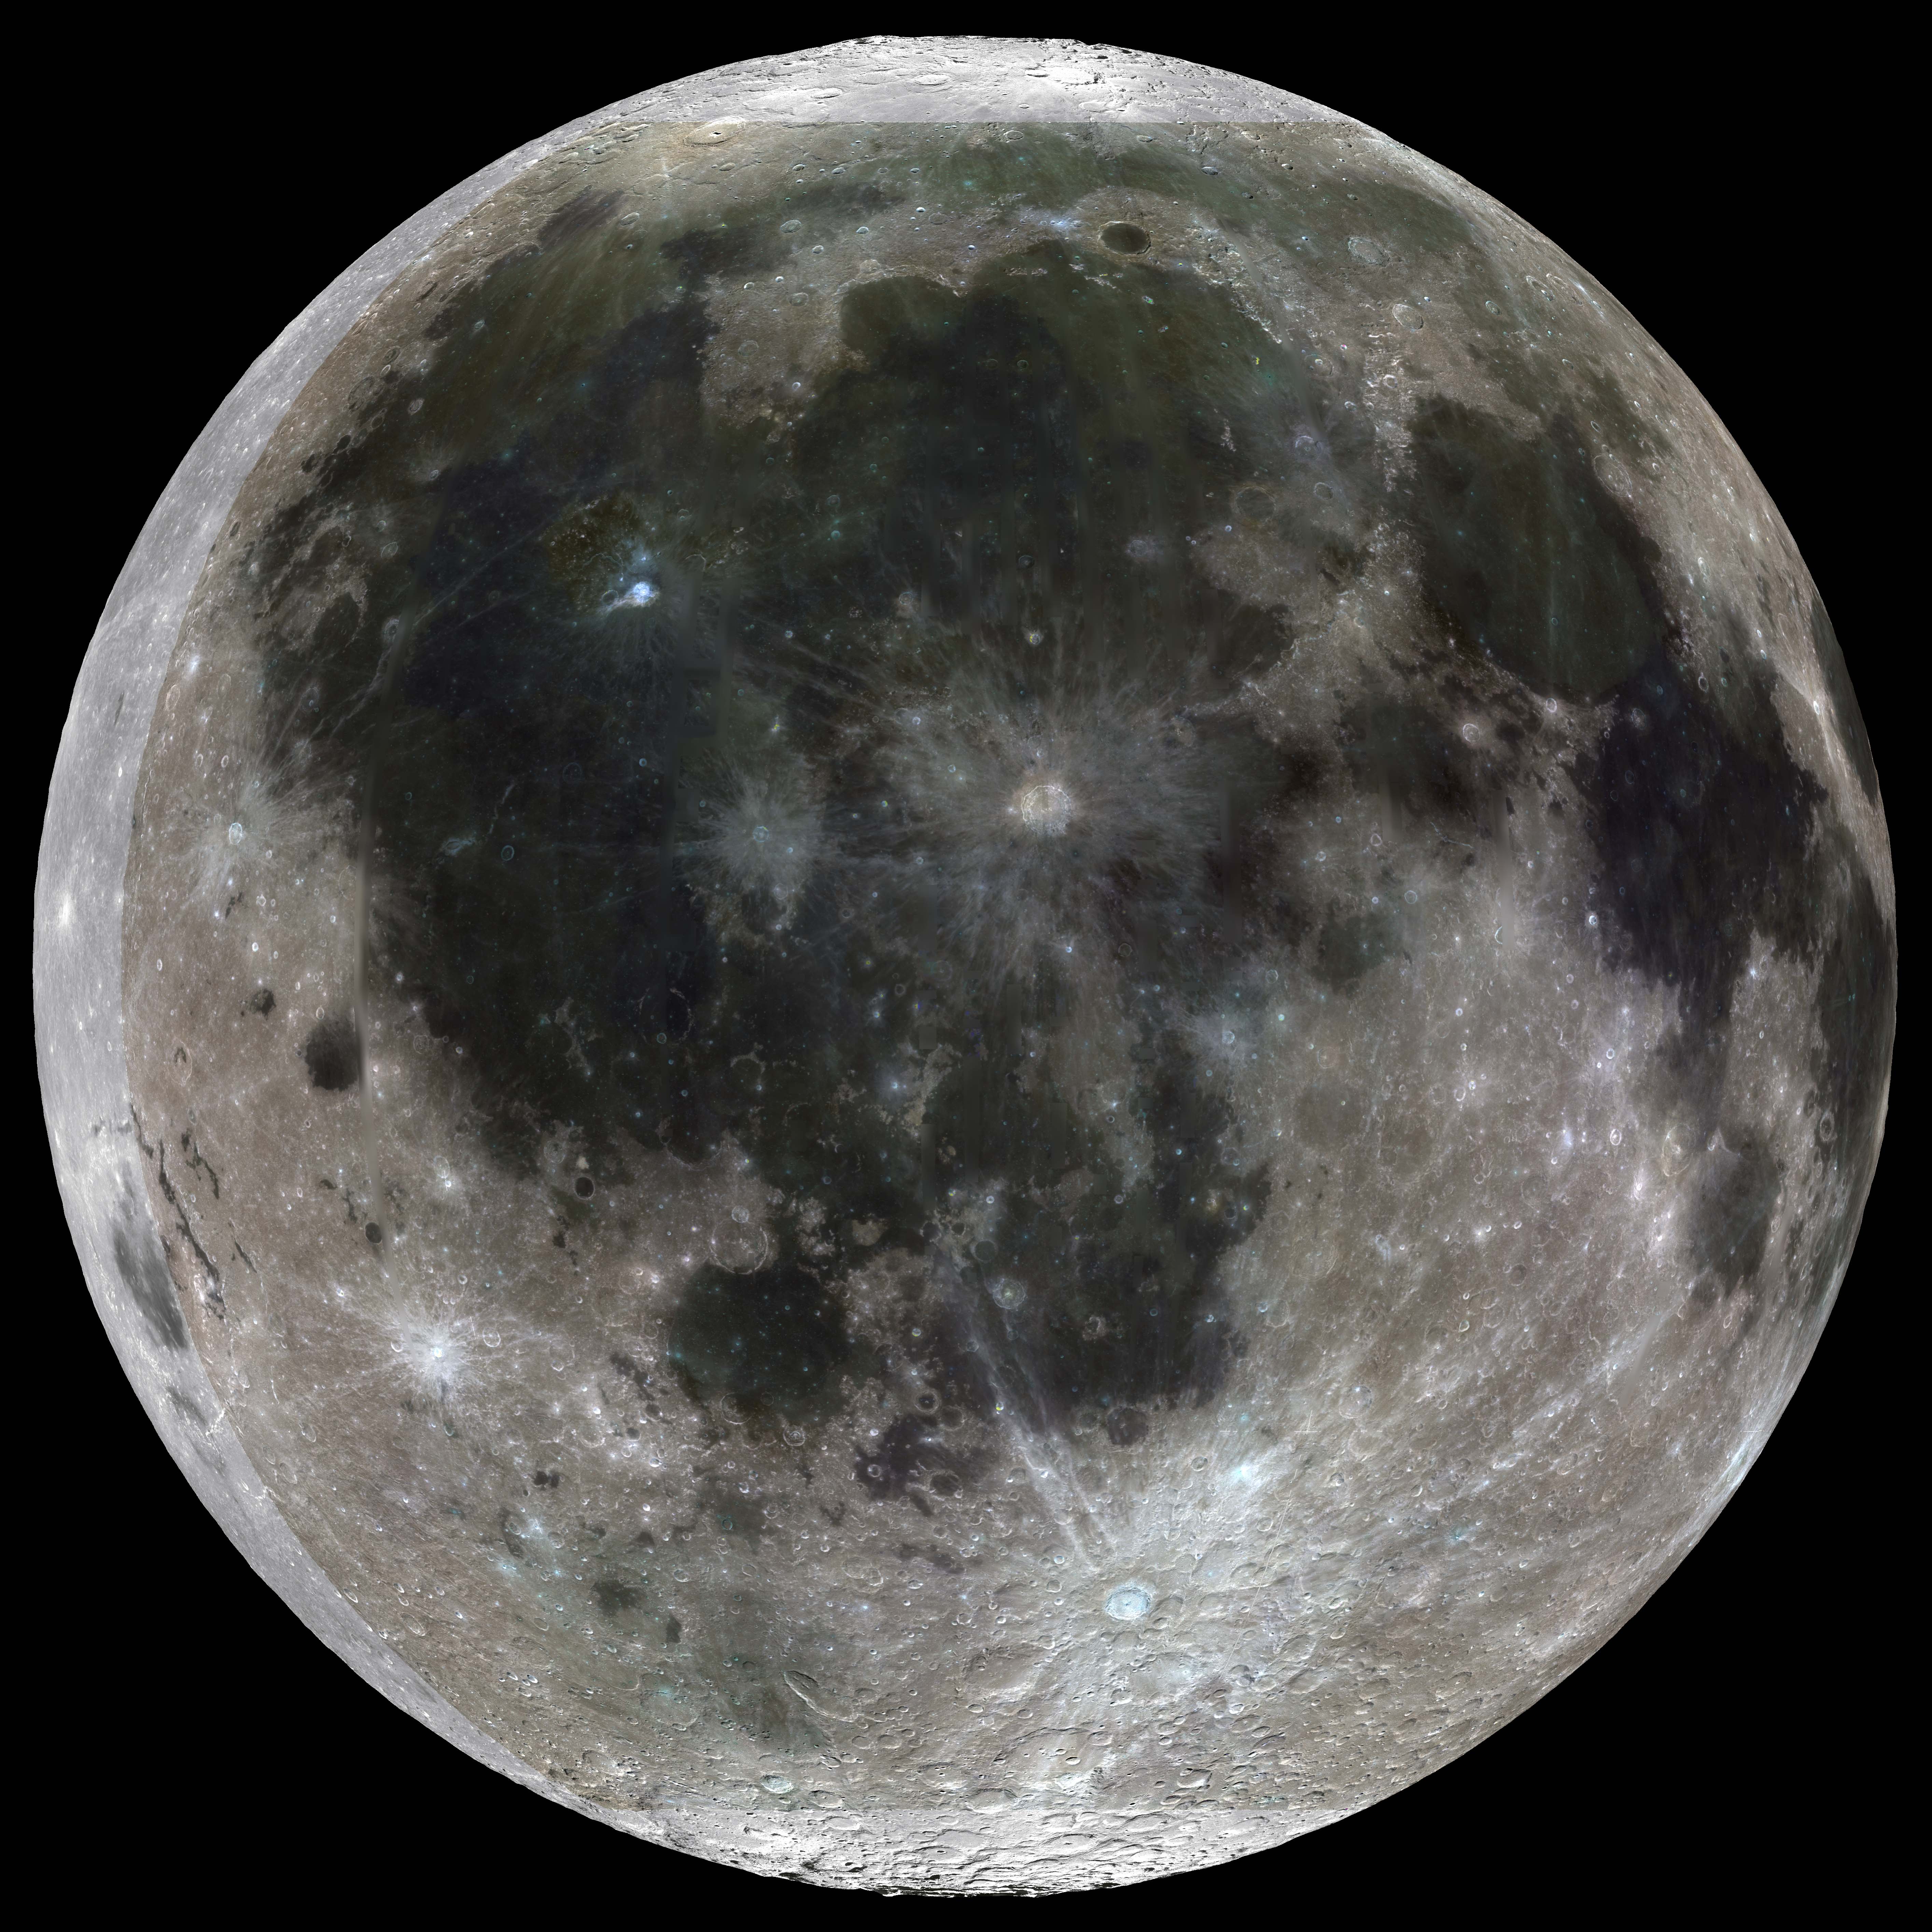
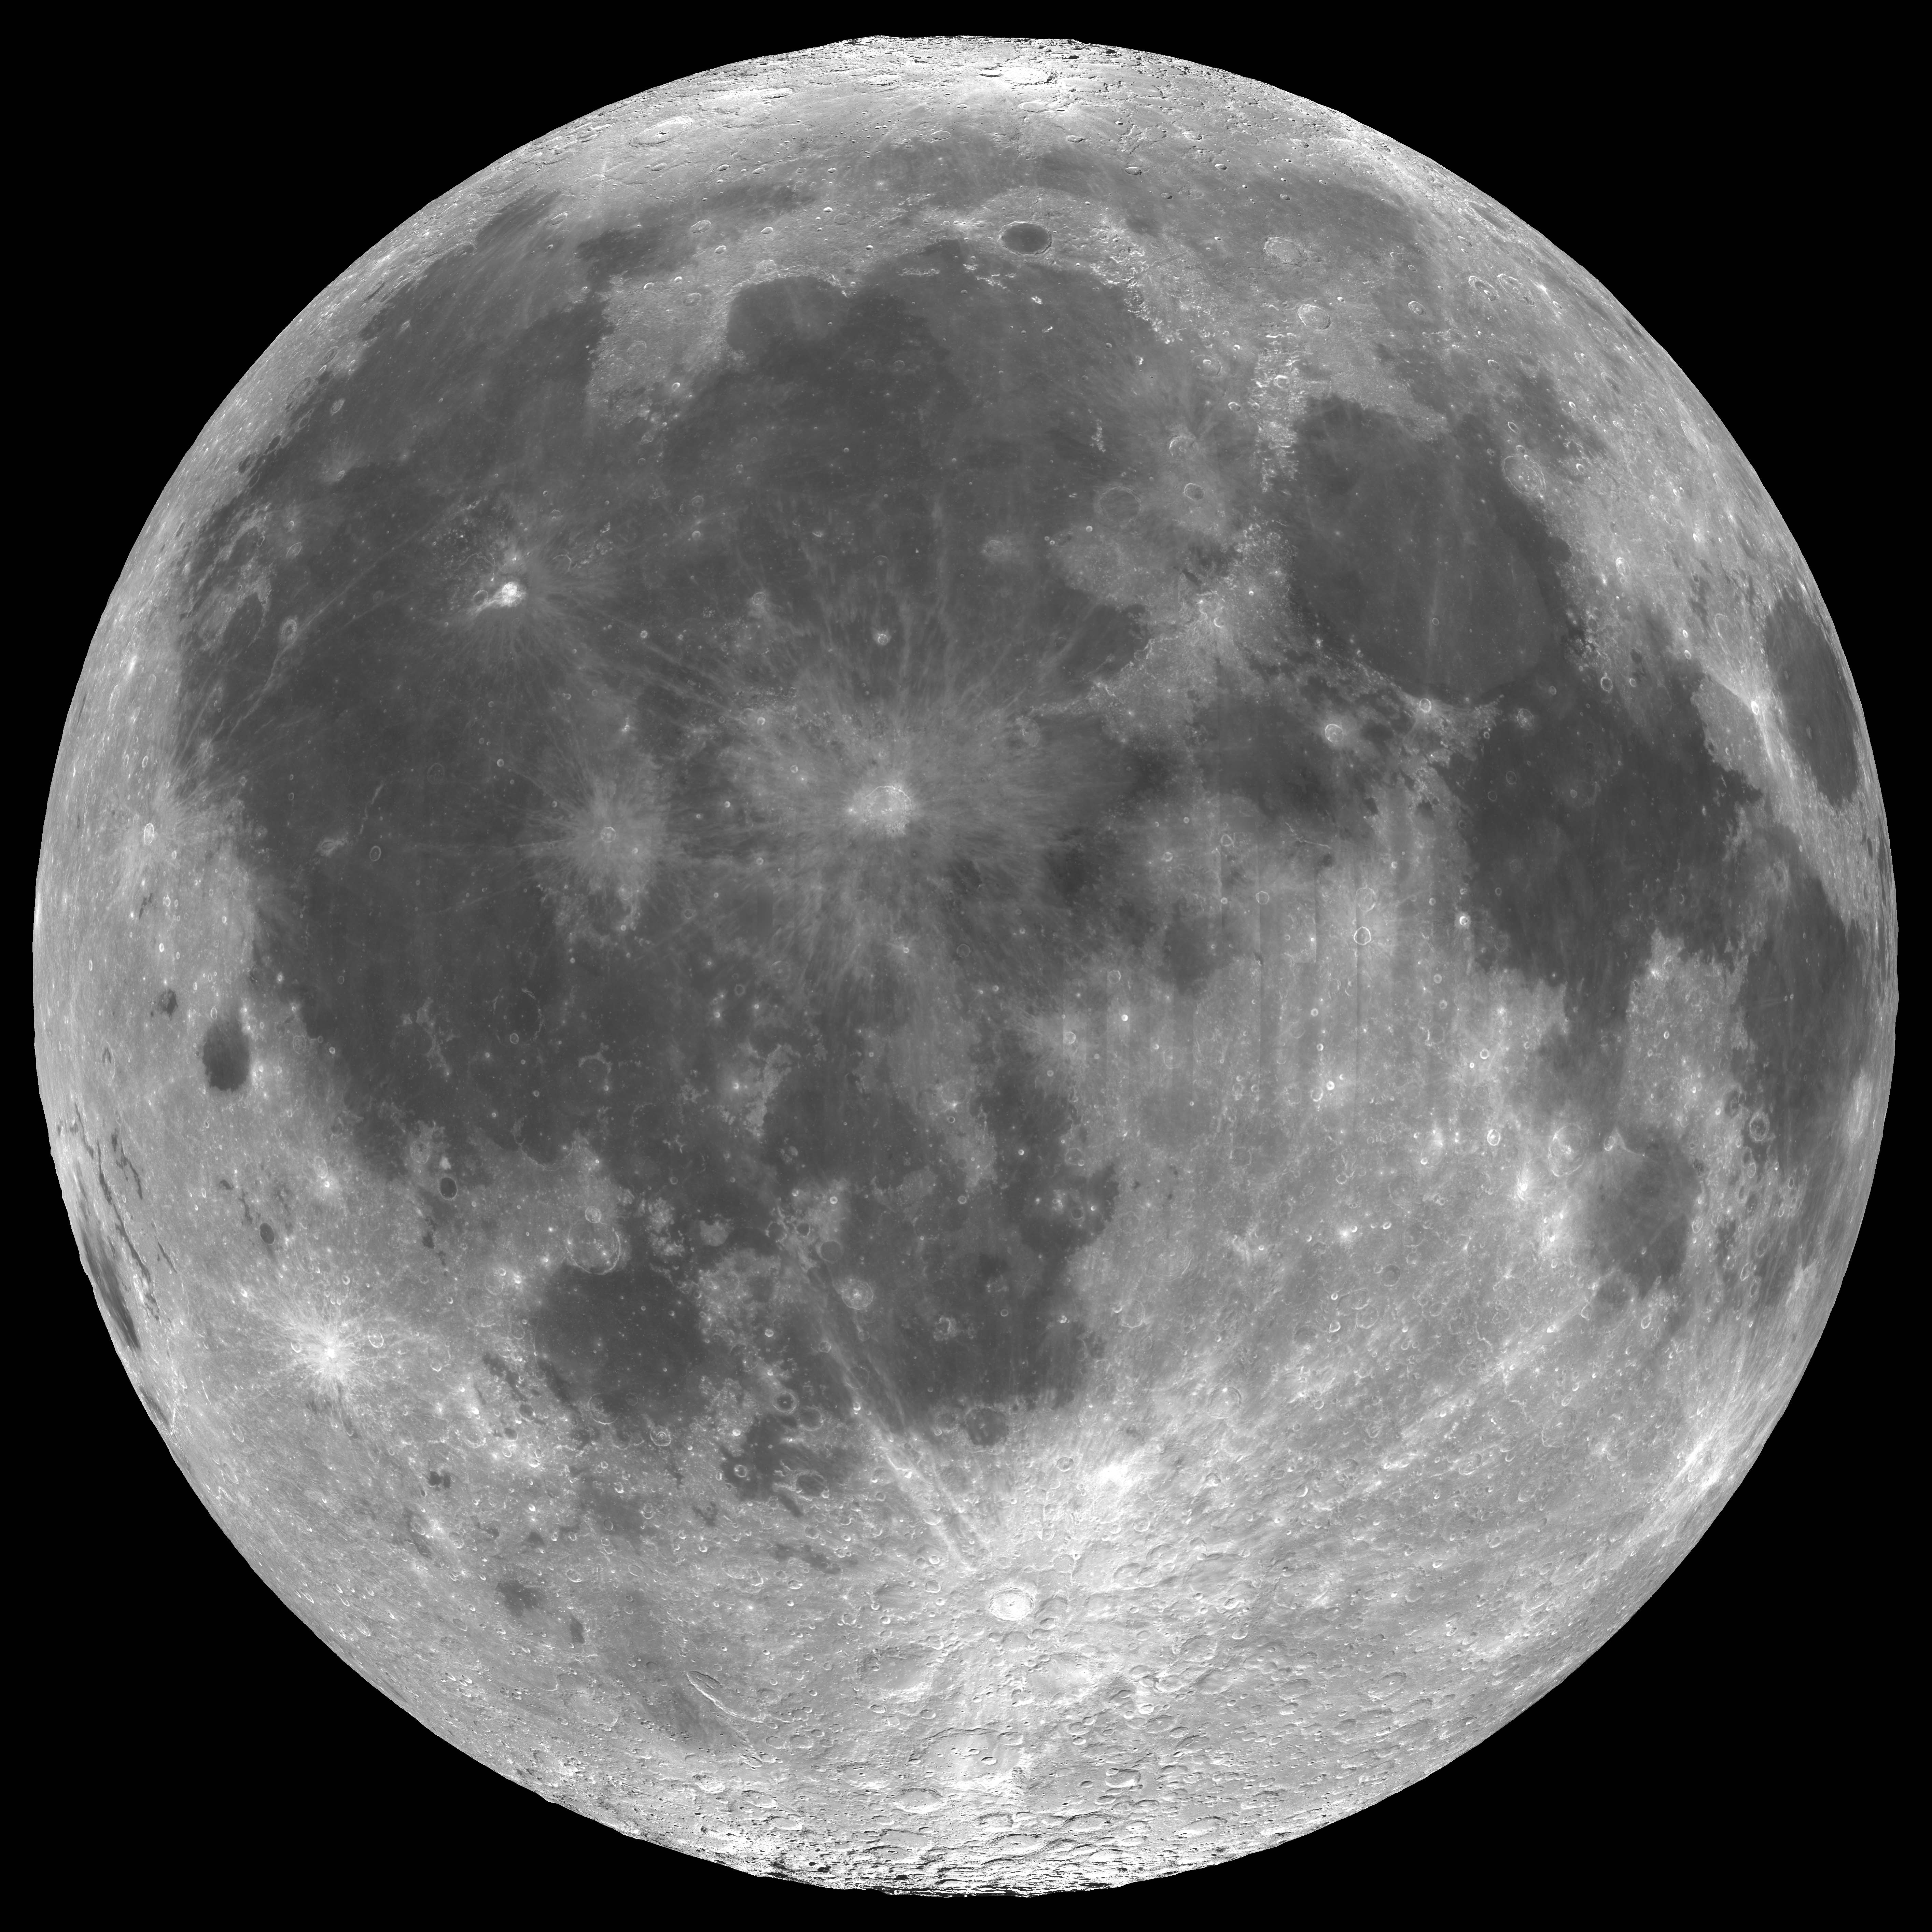
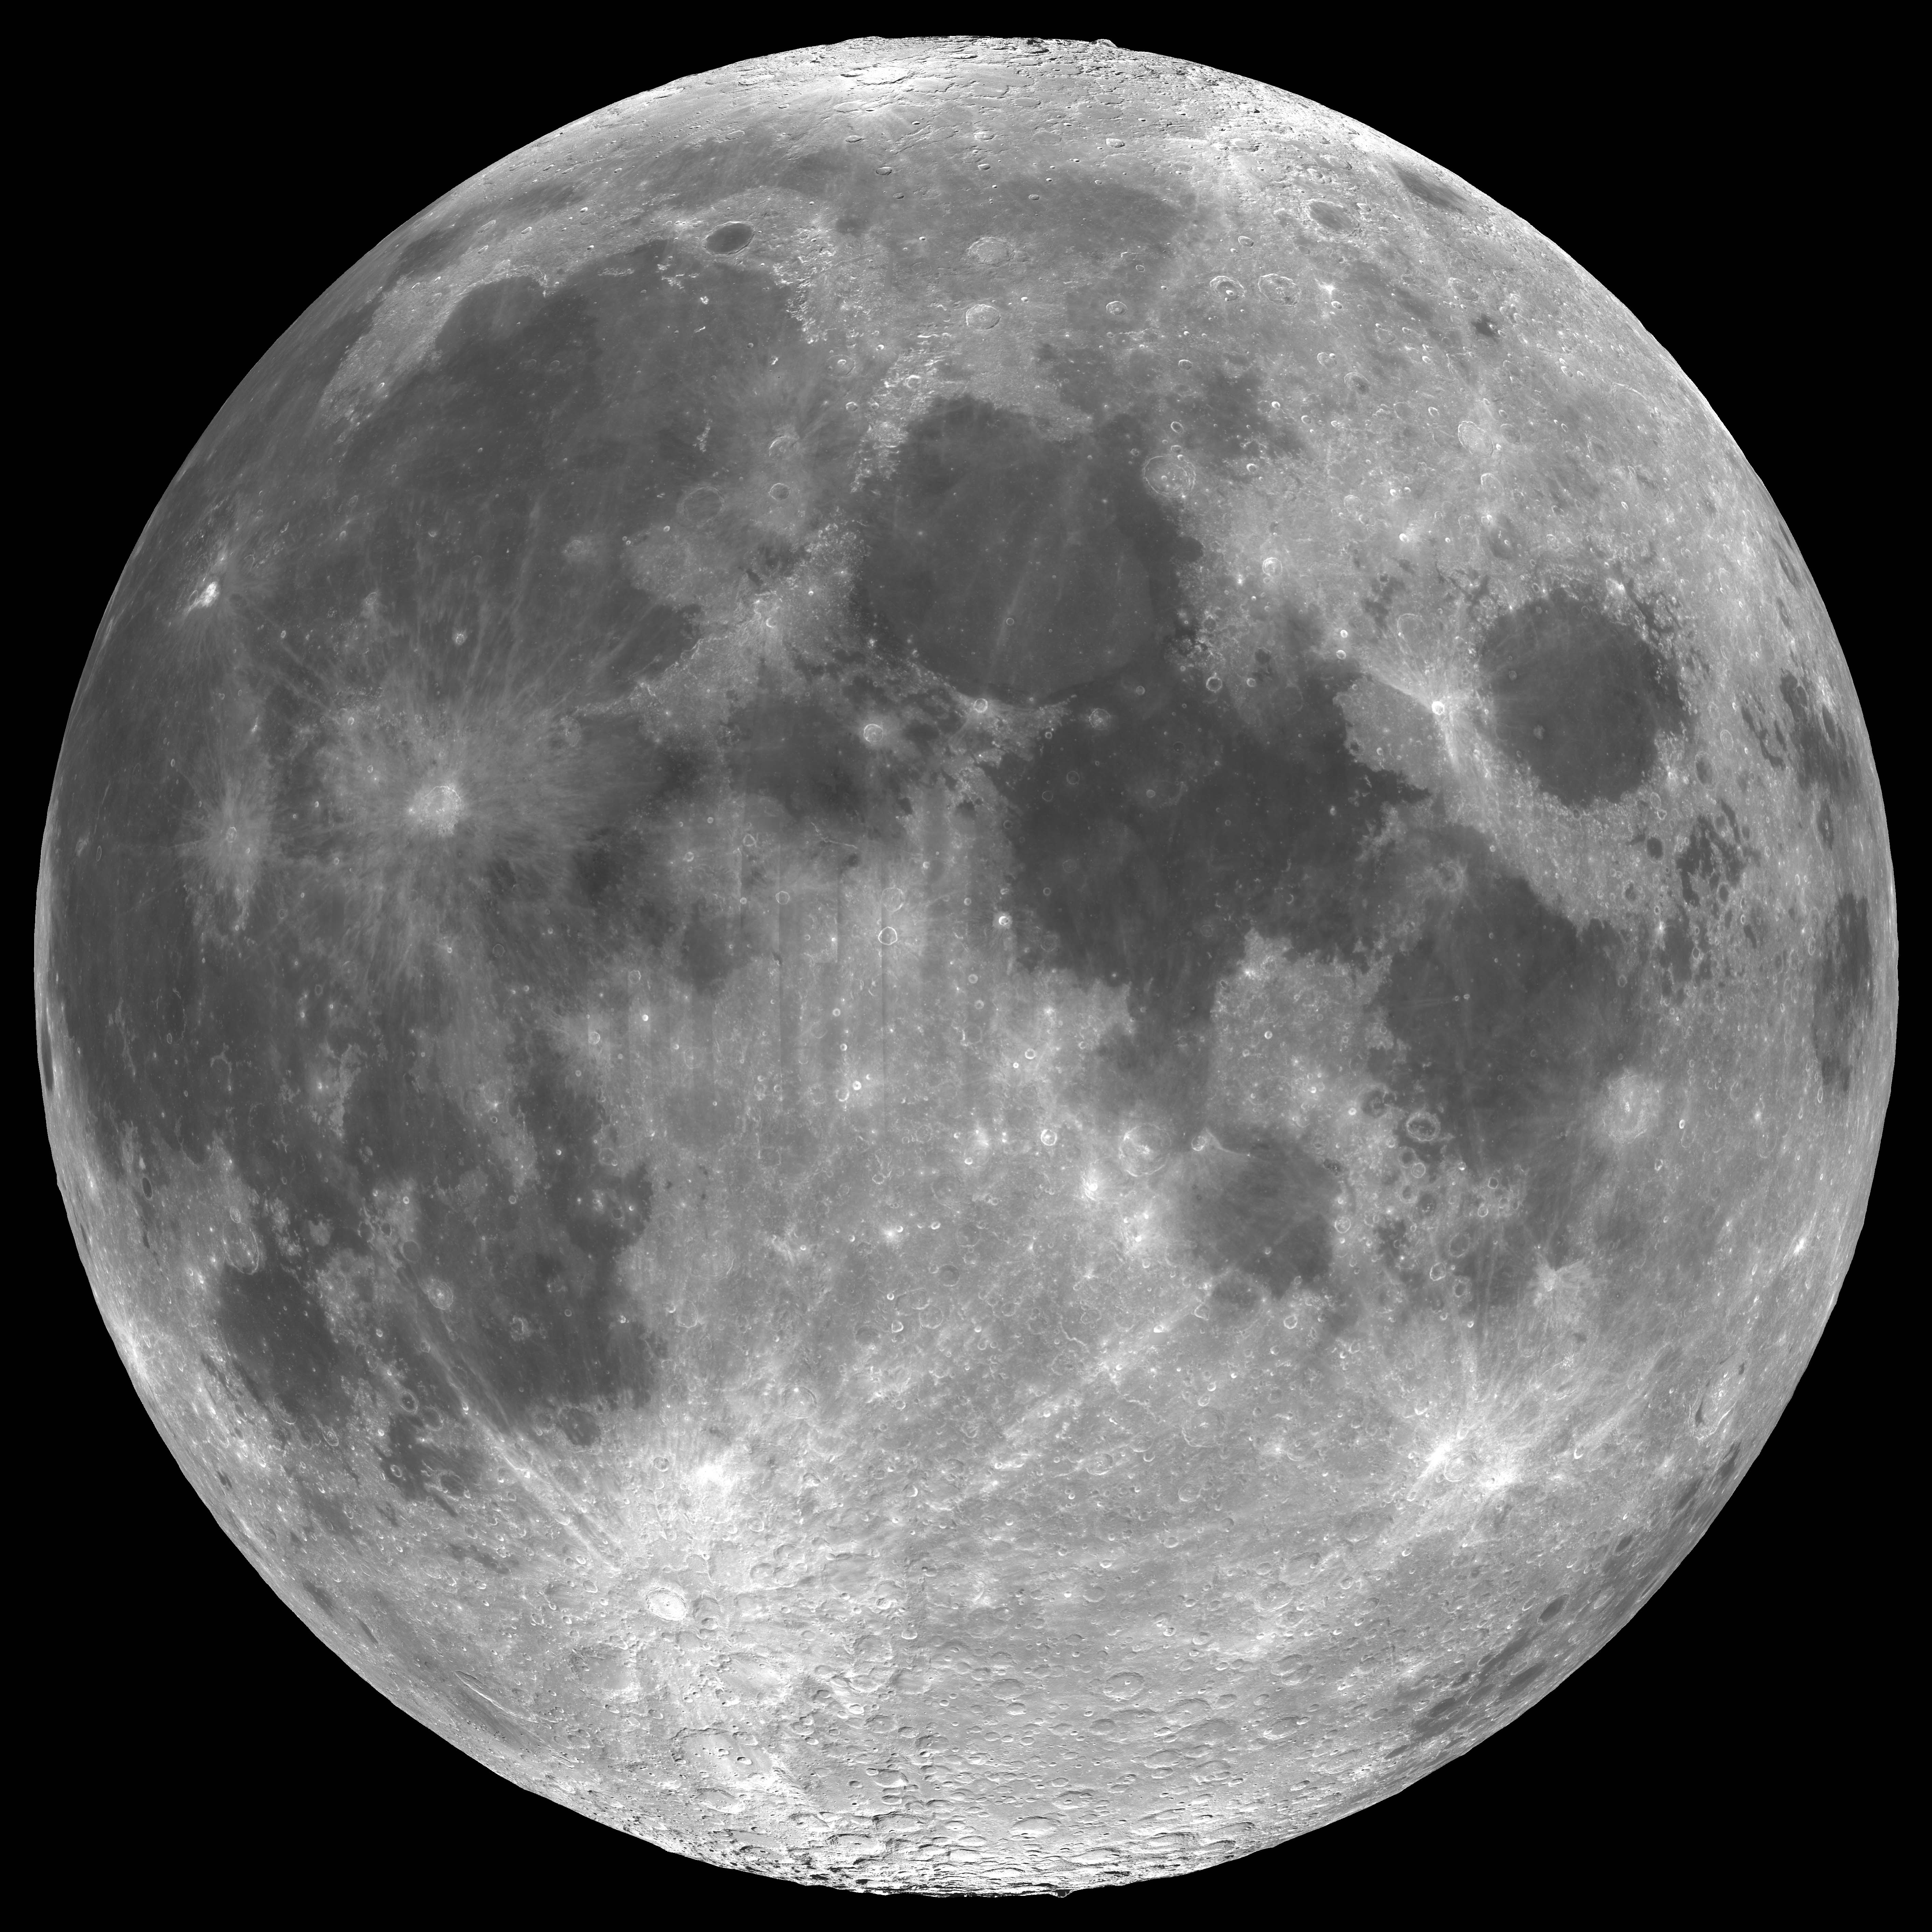
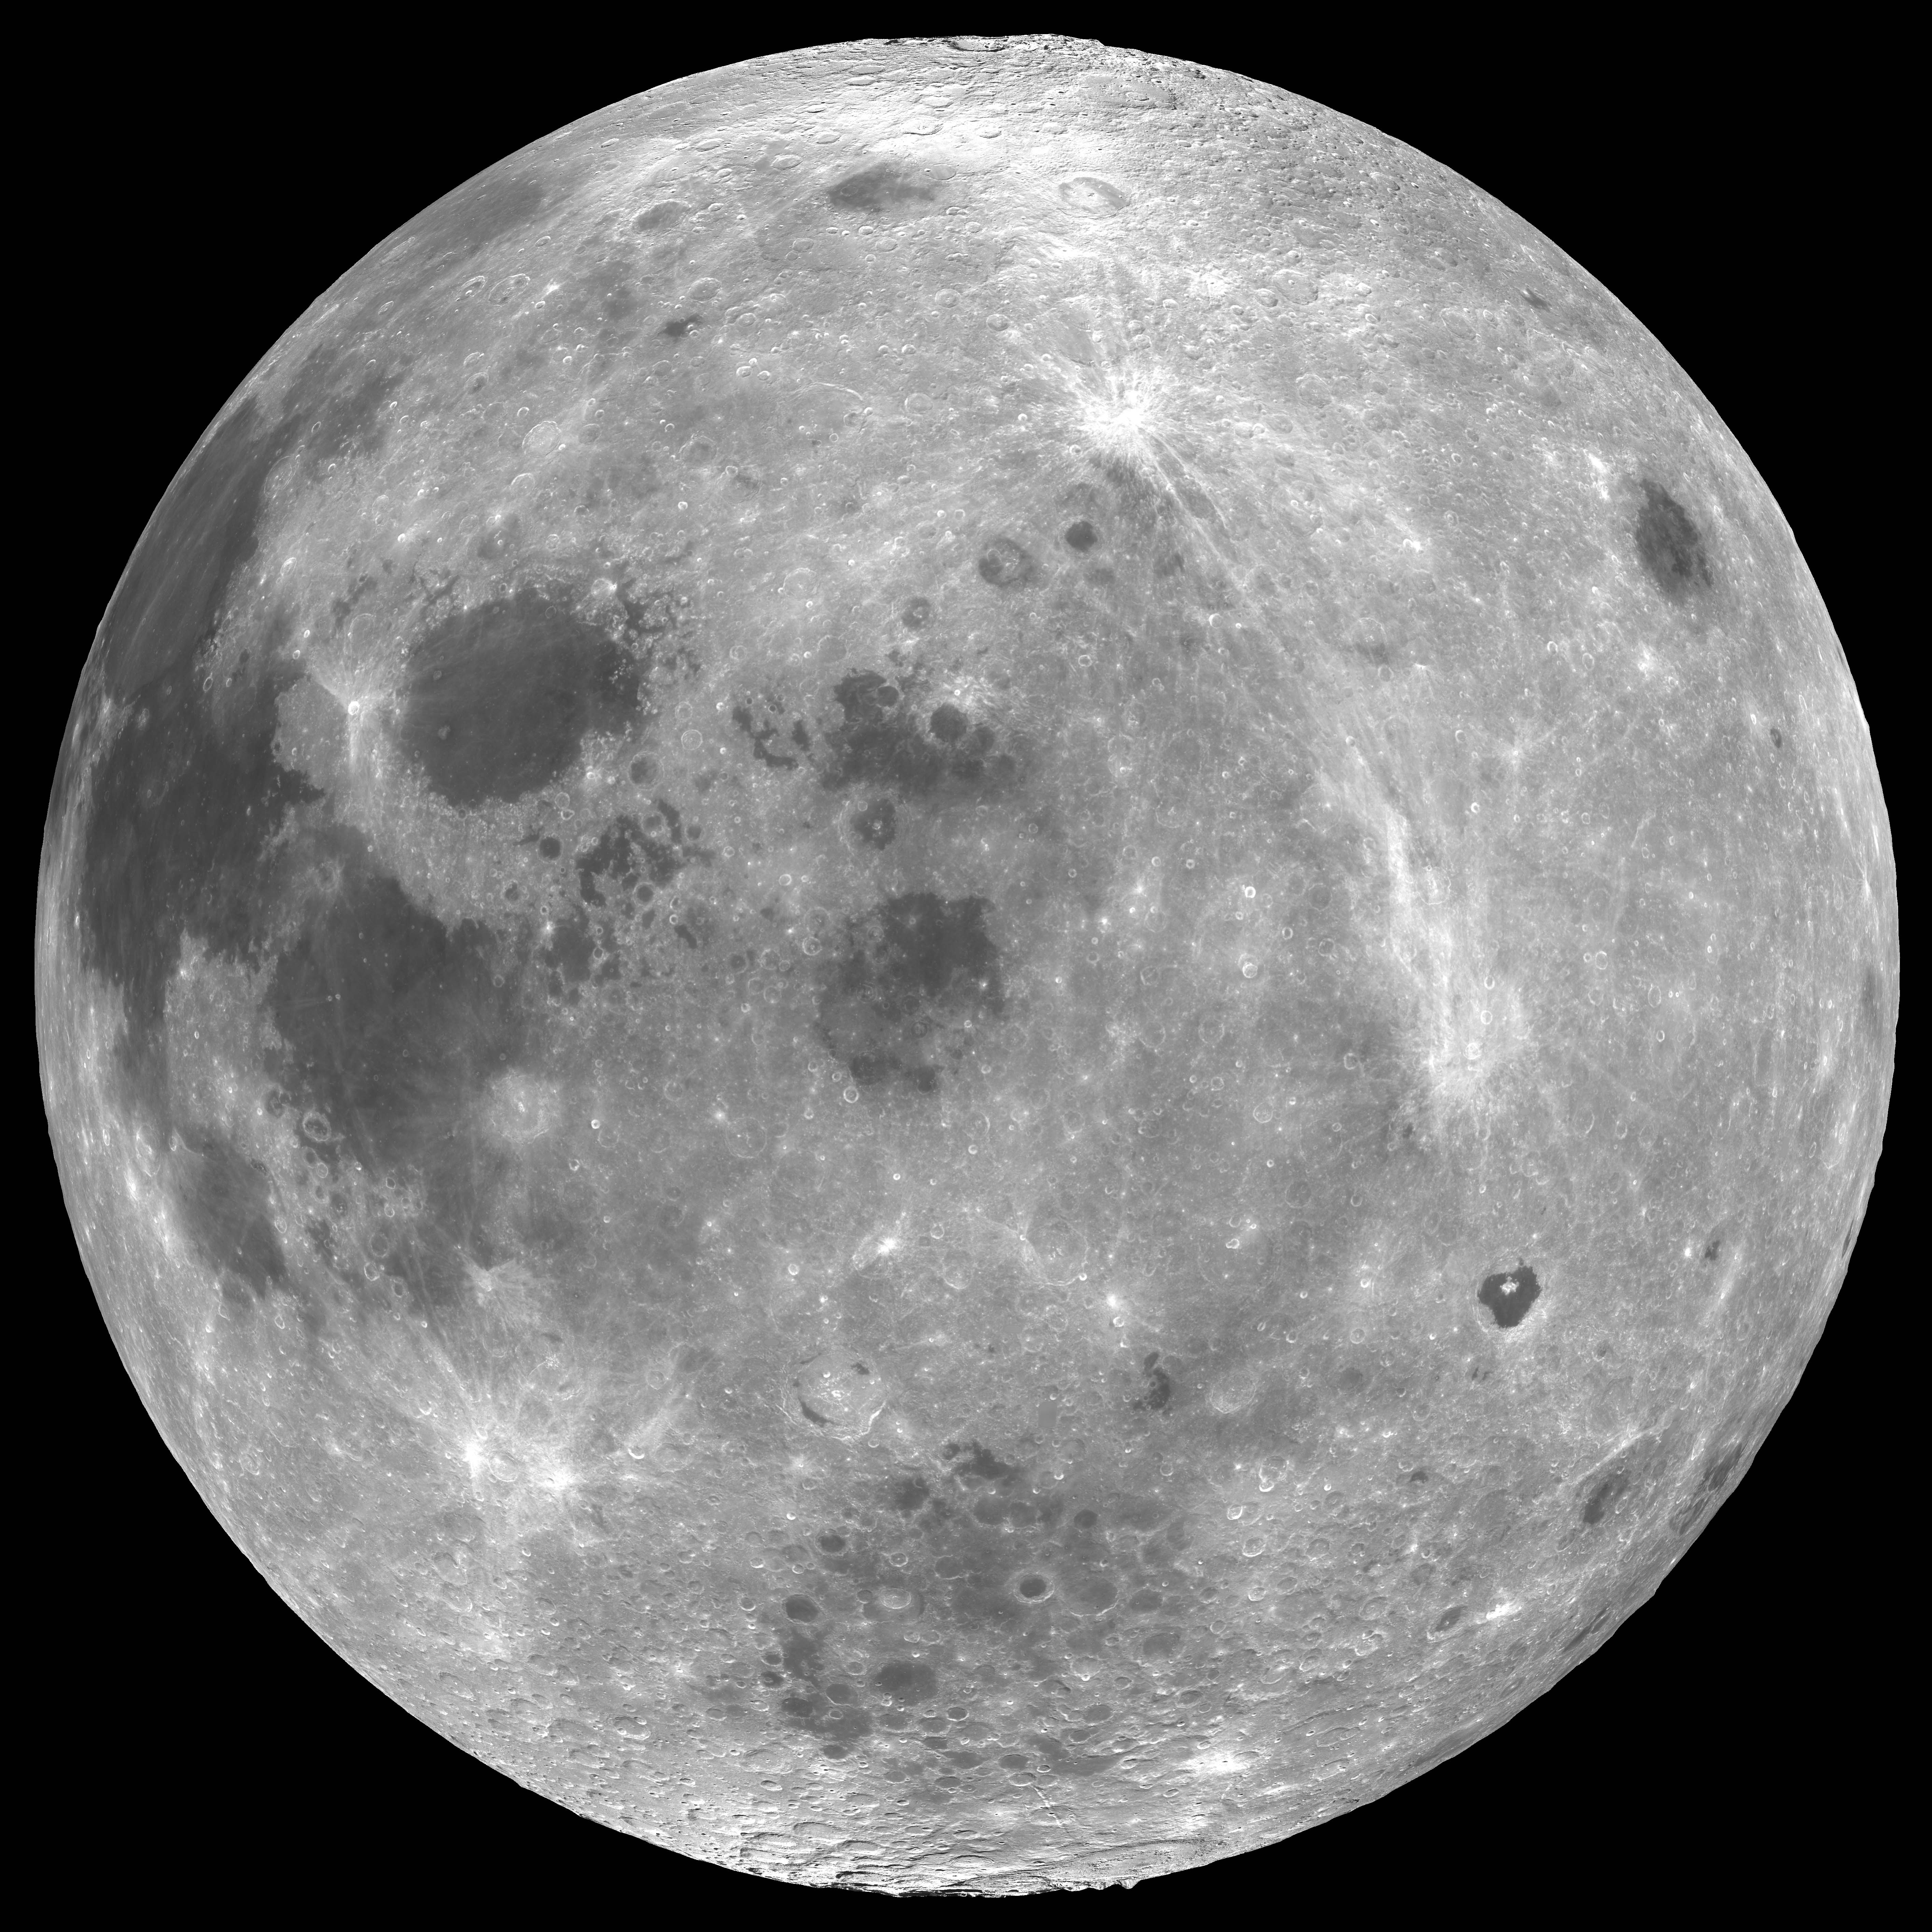
Lunar
DEM products: “Globes”
To illustrate the combination of a smoothed
planet-wide DEM with a Clementine UVVIS mosaic, here are some orthographic
projections of the Moon’s disk as seen from the equator at the following
sub-observer longitudes: 180W,
90W,
25W,
15W,
5W, 5E,
15E,
90E.
Note the 25W view has had a colour image mosaic overlaid over part of the
surface. No height exaggeration has been used, so the mountains on the limb are
mostly as you really see them. However the polar areas are lower than they
should be due to an artefact in the DEM planet-wide mosaicing program (this did
not effect though the polar DEMs in polar stereographic projection above). The
image scale is 1 km/pixel at the equator, hence why the image size is so big.
Mercury
Digital Elevation Models:
The following is from: Cook,
A.C., Watters, T.R., and Robinson, M.S., (2001): Digital Elevation Model Mosaic
of Mercury,
Mercury:
Space Environment, Surface and Interior conference, Chicago, CDROM abstract
#8072 and you can get JPEG enlargements of the figures by
clicking here of Fig 1, Fig 2, Fig 3.
Beethoven
Basin – This is a DEM of the area 140W-110W, 0N-30S (simple
cylindrical projection used with vertical height scaling from DN=0 –6.4 km
to DN=255 +6.4 km or 50m per pixel; actual height resolution varies but one
might expect +/-200 to +/-1000m – this will be reflected in the DEM
noise) formed from several Mariner 10 stereo pair images. Users of this dataset
should be aware that some stereo pairs had weaker stereo than others, so
consequently some sections of the DEM mosaic are topographically noisier than
others. Common sense should tell you where these are. Also due to bad reseau
detection in the Mariner 10 images (these had considerable noise), there
are some artifacts known as “blunders” where the stereo matcher has
created artificial hills or depressions. Generally these are small in size and
mostly obvious upon visual inspection. The DEM tile tilt registration was not perfect
as well either, so you may get some DEM tile edge artifacts in places. Again
this should be obvious. Given all these warnings, please feel free to use this
DEM for visualiztion and for science (after reading the above warnings),
however for the latter it might be worth contacting Tom Waters or Sarah Andre
at the Centre for Earth and Planetary Studies at the National Air and Space
Museum, Washington, DC to see if they have an approved DEM. If you would like
to reference this Beethoven DEM, and learn how it was generated, then you could
try the following: Cook, A.C., Robinson, M.S., Watters, T.R., and Franz,
G, (2001): Digital Elevation Model of Mercury, CDROM Abstract #MS016.pdf, Proceedings of the 34th Vernadsky-Brown
microsymposium, Moscow, Russia.
Discovery
Rupes – This is an early experiment at producing DEM’s
of Discovery Rupes lobate scarp area, utilizing different stereo matcher
correlation patch radii. You can extract individual DEMs using text details
given in the image. The DEMs illustrates that sharper topographic detail is
visible with small patch sizes, but this leads to more topographic noise.
Larger stereo matcher patch sizes reduce noise, but blurs detail (see the
following LPSC
abstract from 1998 concerning the effect on crater profiles
and this was further explored concerning the effect on crater depth to diameter
ratios in a Mercury: Space Environment, Surface, and Interior (2001) abstract by Sara Andre). Fortunately a
happy medium technique was found to preserve detail but not at the expense of
noise (this utilizes data stacks of DEMs as illustrated in the DEM of Discovery
Rupes). It was also interesting to note that the widely quoted 3km height for
Discovery Rupes was in error and it was more like 1.5 km. This has significant
implications for the contraction of Mercury’s crust from interior cooling
(See the following: Watters, T.R., Robinson,
M.S., Cook, A.C., 1998. Topography of lobate scarps on Mercury: new constraints
on the planet’s contraction. 101 Geology 26, 991–994.)
Acknowledgement: For the DEMs extracted from stereo imagery - to NASA
for funding PG&G research money, to the Smithsonian for hosting the
research at the
The information provided on this and other pages by me, Tony Cook (a t c @ a b e r . a c . u k), is under my own
personal responsibility and not that of the